



“MTN delivered a solid operating and financial performance in 2023, as we continued to execute on our Ambition 2025 strategy. We are pleased with the business’ continued resilience under challenging global and regional macroeconomic conditions."
Ralph Mupita
Group President and CEO
Unless otherwise stated, financial and non-financial growth rates are presented on a constant currency basis and are year-on-year (YoY, 12M to December 2023 versus 12M to December 2022).
Service revenue excludes device and SIM card revenue. Data revenue is mobile and fixed access data and excludes roaming and wholesale. Fintech includes MoMo, insurance, airtime lending and e-commerce. Active data users are a count of all subscribers at a point in time who had a revenue-generating event in the specified period (90 days) prior to that point in time and during the past 30 days had data usage greater than or equal to five megabytes. MoMo users are 30-day active users.
| Rm | FY 2023 | FY 22 | % change reported |
% change constant currency |
Q4 23 % change reported |
Q4 23 % change constant currency |
|---|---|---|---|---|---|---|
| Group service | ||||||
| revenue | 210 139 | 196 493 | 6.9 | 13.5 | 1.5 | 11.4 |
| – South Africa | 41 882 | 40 848 | 2.5 | 2.5 | 2.2 | 2.2 |
| – Nigeria^ | 73 853 | 77 023 | (4.1) | 22.1 | (28.7) | 25.0 |
| Group EBITDA˜ | ||||||
| (before once-off | ||||||
| items) | 90 350 | 90 814 | (0.5) | 9.8 | (10.7) | 5.1 |
| – South Africa# | 18 623 | 19 480 | (4.4) | (4.4) | (0.4) | (0.4) |
| – Nigeria^ | 36 916 | 41 087 | (10.2) | 14.2 | (42.3) | 1.1 |
| Group EBITDA | ||||||
| margin | 40.9% | 43.9% | (3.0 pp) | (1.2 pp) | (4.9pp) | (2.1pp) |
| – South Africa# | 35.9% | 38.5% | (2.6 pp) | (2.6pp) | (1.0pp) | (1.0pp) |
| – Nigeria^ | 49.7% | 53.1% | (3.4 pp) | (3.6pp) | (10.0pp) | (10.0pp) |
˜ Group earnings before interest, tax, depreciation and amortisation.
# Excludes tower sale gain.
^ MTN Nigeria performance impacted material naira devaluation from June 2024.
Results overview
Group President and CEO Ralph Mupita comments:
Resilient operating result amid macroeconomic and geopolitical challenges
“The MTN Group sustained a resilient performance in 2023, with solid underlying operating momentum and pleasing progress in our key strategic initiatives during a period characterised by geopolitical and macroeconomic headwinds. The sharp devaluation of the Naira during the period impacted our reported results for both MTN Nigeria and MTN Group. We continued to invest in our business and execute on our Ambition 2025 strategy given the sustained structural high demand for data and fintech services evident across our markets. Data traffic across our operations grew at 26.3% (35.4% excluding JVs) while fintech transaction volumes grew at 32.2% in the period.
Solid operational execution and performance
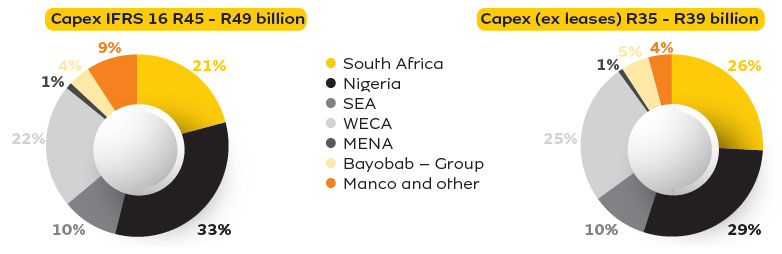
We deployed R41.1 billion of capex (ex-leases) to support the focused execution of our Ambition 2025 strategy. The progress of MTN South Africa’s (MTN SA) network resilience plan was a key success in the year, which significantly improved network availability and supported commercial initiatives, despite ongoing loadshedding. By the close of 2023, MTN SA had achieved network availability of approximately 95% ahead of schedule, with availability of approximately 98% on the cohort of sites where resilience investment had been completed.
More broadly, the business' customer base was resilient ending 2023 at 295 million (up 2.0%), despite the adverse effects of SIM registration regulations in key markets, supporting robust service revenue growth of 13.5%*.
In terms of service revenue growth in our larger markets, MTN Nigeria was up by 22.1%*, MTN South Africa (MTN SA) by 2.5% and MTN Ghana by 35.0%*. Adjusting for conflict-affected MTN Sudan, the Group's service revenue growth for 2023 would have been 14.1%*.
Active data customers increased by 9.3% to 149.7 million, with data traffic up by 26.3% (up 35.4% excluding JVs). MoMo active users increased by 5.0% to 72.5 million, impacted by a strategic shift in focus to wallet customers in Nigeria and base clean ups in Côte d'Ivoire and South Africa. The momentum in volume and value of MoMo transactions remained strong and were up by 32.2% and 47.4%*, respectively. This underpinned strong advanced service revenue growth of 54.8%*.
Group EBITDA increased by 9.8%* YoY. The EBITDA margin of 41.5%* (2022: 42.7%*), was affected largely by higher inflation and the effects of foreign currency devaluations. The extent of these impacts were moderated through delivery of our expense efficiency programme, which realised savings of R2.6 billion for the year – exceeding our 2023 target of R1.5 billion.
The Group’s financial results were impacted by restatements and the revision of unrealised forex losses in MTN Nigeria’s results, the effects of which are outlined below.
Healthy balance sheet and liquidity positions
As of 31 December 2023, the Group's net-debt-to-EBITDA ratio of 0.4 x (31 December 2022: 0.3 x) was comfortably within our targeted loan covenant level. Our net interest cover of 6.4x was also within covenant thresholds. Holding Company (Holdco) leverage held firm and within guidance at 1.4x (December 2022: 0.8x), supported by R13.4 billion in cash upstreamed from operations over the year, of which R5.4 billion was in Q4. Our Holdco leverage ratio was impacted by depreciation of the rand against the US dollar in 2023 as well as our election of the scrip dividend options from MTN Nigeria and MTN Ghana for the FY 2022 dividends given paucity of foreign currency in those market.
We raised a total of R24 billion in Holdco loan facilities in the year, which were deployed to refinance maturing debt, manage the debt maturity profile and bolster Holdco liquidity. The funding was raised under the DMTN programme, local banks and international bank markets. In line with MTN’s strategy to deleverage non-rand debt at the Holdco, we were pleased to have early redeemed a total of US$353 million of the MTN 2024 Eurobonds during FY 2023 through a cash tender offer. This brought the total amount of 2024 Eurobonds redeemed to US$1.2 billion to date. Our Holdco debt currency mix ratio (US$:ZAR) improved to 23:77, well within our medium-term objective of maintaining foreign currency denominated debt to below 40%.
We ended the 2023 financial year with a healthy Holdco liquidity position of R44.1 billion in cash and committed facilities.
Ambition 2025 execution
On 5 February 2024, we announced that MTN and Mastercard signed definitive agreements with Mastercard for a minority investment of up to US$200 million into MTN Group Fintech at a valuation of US$5.2 billion on a cash and debt-free basis. The transaction was originally announced on 14 August 2023 and is subject to customary closing conditions. We are excited about this partnership, particularly the commercial agreements, which we expect to support the accelerated growth of our fintech business within payments, e‑commerce and remittances.
We have also advanced our work to structurally separate the fibre business, with the engagements to secure regulatory clearances in key markets being the main priority. Bayobab also acquired the fibre network of MTN Zambia in a sale-and-lease back transaction and added new fibre operating licences in Uganda, Côte d’Ivoire and Central African Republic.
On 21 February 2024, all the conditions precedent were finalised in relation to MTN’s sale of 100% of the shares in MTN Afghanistan to Investcom AF Limited (Investcom AF) and accordingly, the sale has now been completed. The exit from Afghanistan completes the phase of our Middle East exit of our previously consolidated subsidiaries in that region.
In December 2023 , MTN also accepted an offer from Telecel for the acquisition of MTN’s equity interests in MTN Guinea-Bissau and MTN Guinea-Conakry, in line with the portfolio optimisation focus within our Ambition 2025. The agreement remains subject to a number of conditions precedent.
We made good progress in advancing key environmental, social, and governance (ESG) initiatives and achieving our strategic goal of creating shared value – the pleasing strides we have made in this regard are captured on Creating shared value. In terms of our eco-responsibility priorities, we achieved a 13.1% absolute reduction in Scope 1 and 2 emissions in 2023.
FY 2023 dividend declaration and FY 2024 guidance
The Board declared a dividend of 330 cps for FY 2023. For FY 2024, in line with our dividend policy and guided by our capital allocation framework, the Board anticipates paying a minimum ordinary final dividend of at least 330 cps after the announcement of full year results in March 2025.
Outlook, priorities and medium-term guidance
Looking ahead, the near-term macro headwinds to our business remain, particularly naira volatility. More broadly across our markets, inflation rates and interest rates may stay elevated. Tariff increases for voice and data, will be required in the period ahead to mitigate network related expenses, and these will require regulatory approval across several markets. In this context we are focused on delivering on our medium-term guidance and continue executing on our strategic objectives.
Having achieved substantial progress on its network resilience programme, the focus for MTN SA will be to complete this work and accelerate the recovery of its topline and EBITDA margin to medium-term guidance ranges over time.
MTN Nigeria’s near-term focus will be to drive margin recovery and strengthen its balance sheet given the sharp devaluation of the naira since June 2023. Engagements with regulatory authorities on much-needed tariff increases for the industry remain ongoing and a priority, and there is comprehensive work in progress to look at reducing and mitigating the foreign exchange exposures impacting its business, including tower operating costs.
MTN Ghana and MTN Uganda are leading the increased growth and contribution to Group of the Markets portfolio. These Opcos have reported strong FY 2023 results and are positioned to capture the growth opportunities in their respective markets.
We are excited about the outlook of our fintech business, having signed the definitive commercial and equity investment agreements with Mastercard. This positions the business well to scale faster and we are excited about the commercial launches of card issuance and acceptance across the footprint.
We maintain our overall medium-term guidance framework, however simplifying our objective for fintech. We revise this to a medium-term growth target (in constant currency) of ‘high-20% to low-30%’, from ‘at least 20% of Group service revenue contribution by 2025’. Importantly, we are also maintaining our capital allocation framework to support the execution of our strategy and will continue to invest in the growth of our business with a capex (ex-leases) target of R35-39 billion for FY 2024, based on current currency assumptions.
As we continue to navigate the macro challenges in our trading environment in 2024, we reflect with both pride and humility on the progress of our business over the past 30 years. This has been powered by the dedication and resilience of our people, as well as the support of our customers and broader stakeholders. We will continue the focused execution of our strategy to drive growth and unlock value for all our stakeholders.”
Operating context
The business weathered a challenging macroeconomic environment, with the blended rate of inflation across our markets remaining elevated, averaging 16.7% in 2023, from 15.1% in 2022. More encouragingly, inflation started to trend lower in H2 in key markets such as South Africa, Ghana and Uganda. Forex markets remained volatile, with limited availability of hard currency, especially in Nigeria. The US dollar appreciated by approximately 97%, on closing rates against the naira in 2023, resulting in material financial impacts on our business.
Our regulatory environments continued to evolve and have been well managed by the business. In particular, we have navigated the headwinds presented by SIM registration directives in some of our markets to ensure minimal impacts on service revenue.
The crisis in Sudan deepened, with the ongoing conflict resulting in fuel shortages, power outages and disruptions to network availability. MTN extends its deepest sympathies to those impacted by the nation’s strife. More broadly, geopolitical volatility also had knock-on effects on our trading environments.
In this context, MTN produced a solid set of results in 2023, showcasing its ability to persevere and execute well in a demanding operating environment. Group
service
revenue
grew
13.5%* to
R210.1
billion (2022:
R196.5
billion), supported by growth of
35.0%
* in MTN Ghana,
22.1%* in MTN Nigeria and 2.5% in MTN SA.
The healthy topline growth in regions such as SEA and WECA also contributed to the Group’s solid overall result. MTN Sudan continues to trade in a particularly challenging context, given the ongoing conflict in the country, and saw a
12.3%* decline in service revenue. Excluding MTN Sudan, the Group service revenue would have increased by
14.1%.
Continued resilience in voice and structural growth in data
Voice revenue increased by 3.3%*, with growth in voice traffic of 17.5% YoY (excluding JVs). We continue to see the substitution of voice with data and are focused on the commercial execution of our CVM initiatives and driving growth through segmented customer propositions. Adjusting for MTN SA – a more mature voice market within the Group portfolio – overall voice revenue increased by 6.3%*.
Data revenue increased by 23.0%*, driven by growth in active data subscribers of 9.3% (10.2% excluding JVs) and an increase in data use of 15.6% to 8.60 GB per user per month (22.9% to 6.10GB excluding JVs). In 2023, data traffic increased by 26.3% (35.4% excluding JVs), supported by the ongoing investments in our networks' capacity and quality.
The population covered by our 3G, 4G and 5G networks grew by 10.6 million, 32.3 million and 46.2 million respectively. We recorded 183.3 million smartphones on our network, representing 62.6% penetration of our customer base (2022: 57.5%).

Building the largest and most valuable fintech platform
Fintech sustained a strong overall revenue growth trajectory, with an increase of 21.8%* YoY. The momentum in advanced services revenue (up 54.8%*) was particularly pleasing and increased its mix relative to basic services (up 21.2%*). The contribution of advanced services to total fintech revenue rose to 20.4% (up 4.4pp).
Active MoMo users increased by 5.0% to 72.5 million. Agents and merchants grew by 5.4% and 42.5% to 1.3 million and 2.1 million respectively. The development of our overall fintech ecosystem remained robust with a 32.2% increase in transaction volumes to 17.6 billion transactions, and transaction value up by 47.4% * to US$272.1 billion.
We renewed the scope of partnership with Ericsson for our core wallet platform to enable more focus on advance services product development. To support our priority to broaden the scope of financial inclusion users, we continue to work with Ericsson´s Converged Wallet (ECW) platform. This is accompanied by market proven specialised solutions in order to provide efficient, inclusive and functionally-rich user experience.
As certain of the costs from the partnership are capitalised, such as software licensing, this benefits EBITDA but resulted in higher capex in the year, as well as depreciation and interest expenses over the period of the agreement.
Key fintech markets
MTN Ghana’s fintech revenue continued its accelerating growth trend and posted a YoY increase of 46.4%* driven by convenient and secure financial services delivered to its 15.2 million active users, which were up by 20.1% YoY (net additions of 2.5 million). Our partnerships in Ghana with various financial institutions, agents (229k) and merchants (168k) supported the expansion of the ecosystem, making it easier for customers to transact and save, as well as access micro-loans, micro-insurance and international remittances.
MTN Uganda’s fintech revenue grew by 17.6%*, with strong growth in advanced service revenues as MoMo adoption continued to scale, especially MoMo Pay. Fintech subscribers increased by 10.5% YoY to 12.1 million (net additions of 1.2 million). Merchants increased by 68.7% to 292k. Advanced service revenue grew steadily as we introduced new international money transfer corridors to Asia and Europe.
In Nigeria , fintech revenue increased by 3.7%*, supported by the recovery in growth of active wallet users, up 163% to 5.3 million. This represented a strong acceleration in Q4, as the execution of our commercial strategy gained traction. The momentum in our broader ecosystem metrics was also healthy, in terms of which the active agent base expanded by 46.0% to 326k agents. Further, the active merchant base has built up to 324k merchants since June 2023 .
In other markets, the operating environments and performances in Zambia and Côte d'Ivoire remained challenging. Both markets have promising economic prospects and exciting growth opportunities – we are focused on positioning our fintech operations to unlocking the fintech opportunity. South Africa delivered a robust performance in FY 2023, underpinned by the growth in advance services from a nascent base.
Key fintech verticals
Our payments and e-commerce ecosystem grew strongly as we leveraged our consumer and merchant footprint. The total value of merchant payments made through MoMo rose by 46.1%* YoY to US$16.1 billion.
In BankTech , we facilitated a total loan value of US$1.9 billion up 66.0%* as we capitalised on our scaled mobile wallet business, rich data and customer footprint. Uganda and Ghana were the key drivers of performance with strong growth in loan users.
The total value of remittances grew by 44.4%* YoY to US$3.3 billion. This was driven by growth in the number of active corridors as well as focused marketing awareness efforts and improved customer experience. Notably, we launched international remittance services in both South Africa and Nigeria, providing a low-cost and real time transfer service that enables customers to share in the benefits of formal financial services.
Our InsurTech platform aYo, within our strategic alliance, reported 6.1%* YoY growth in revenue. This was driven by our focus on higher average-revenue-per-policy, products with improved margins and new revenue streams. We have repositioned aYo's strategic operating model to enable its expansion into new markets and long-term, sustainable growth. In South Africa, the partnership delivered pleasing growth in its new device insurance business, which is on a positive footing to continue scaling.
Growing our other platforms
Digital revenue increased by 10.0%* YoY to R3.5 billion, driven by the strong performance in Nigeria, where revenue grew by 65.6% YoY. The Gaming and Video verticals – our key focus areas – continued to deliver robust growth of 26.8% and 30.8% respectively.
We expanded our digital services portfolio with partnerships such as Apple Music in Nigeria as well as Disney+ and Showmax in South Africa. We also focused on gaming, with the launch of MTN Gameworld, a Gameloft offering in Ghana, Côte d’Ivoire following South Africa and Nigeria.
Our instant messaging platform ayoba grew its user base by 65.0% YoY to 35.8 million MAU. The largest markets for ayoba are Nigeria, Côte d’Ivoire, Ghana and Cameroon with MAUs of 8.6 million, 3.3 million, 2.9 million and 2.7 million respectively. Notably, ayoba has scaled to a MAU base of 11.7 million in countries where MTN does not have GSM operations. This highlights the business’ capacity to expand as an over-the-top (OTT) service beyond MTN’s traditional markets in line with our Ambition 2025 strategy. Ayoba has built up a meaningful footprint in markets such as Kenya, Tanzania, DRC, Egypt and Senegal.
Encouragingly, ayoba has achieved a notable rise in user retention driven by enhanced communication features, along with a blend of global and local high-quality content across various verticals like music, channels, games and services. In 2023, ayoba started monetisation – in line with its phased monetisation strategy – through digital advertising. Successful launches of display advertising and content marketing with sponsored channels, started attracting top brands and advertisers.
Enterprise revenue increased by 23.4%* YoY, due to the strong performance in four of our top six markets, which recorded double-digit growth. Our strategic initiatives and platform transformation approach – focused on converged services solutions –played a crucial role in enabling this.
MTN SA achieved a growth rate of 15.9%, driven by the success of our data product propositions, as well as the expansion of our converged services. Additionally, our efforts to expand our distribution channels contributed to this positive outcome. MTN Nigeria grew enterprise revenue by 45.3%* YoY, fuelled by increased demand for mobile and fixed connectivity services. It was further supported by the acquisition of new customers across all customer segments.
We also delivered strong growth in data and connectivity services in other key markets. MTN Ghana reported YoY revenue growth of 91.2%* and MTN Uganda posted a 20.4%* YoY increase. These performances were underpinned by rapid technological advancements, broadening our customer reach, and creatively implementing digital transformation initiatives.
Wholesale revenue increased by 20.6%*, with a solid national roaming performance in MTN SA driven largely by Cell C, while the multi-year Telkom roaming deal continued to gain traction.
Bayobab (MTN GlobalConnect)
Bayobab integrates its Communication Platforms and Fibre network in an ecosystem that facilitates secure and scalable global traffic within Africa and the rest of the world serving MTN Opcos, “third-party” MNOs, technology corporates and other telecoms services providers.
Bayobab recorded an 8.1% YoY growth in external revenue, amounting to US$372.3 million. Within Communication Platforms, external revenue rose by 9.2% YoY, driven by application-to-person SMS strategic partnerships. Collaborating with key global mobile networks, Bayobab launched over 6.8k roaming services, enhancing international roaming affordability for MTN subscribers throughout Africa. Bayobab is the first telecommunications provider across Africa to become a telecom Business Solution Provider (BSP) for “WhatsApp for business”.
The Fibre segment’s external revenue was flat YoY at US$39.7 million. This performance was supported by new fixed connectivity infrastructure deals valued at US$24.4 million secured in the year. In 2023, Bayobab rolled out approximately 7 000 km of new fibre, augmenting its total proprietary fibre inventory to 114 000km as at 31 December 2023.
Bayobab delivering on Ambition 2025
The business continues to expand its footprint with the incorporation of nine dedicated fibre companies supported by the required licences to operate. Bayobab received new fibre operating licences during Q4 in key markets including Uganda, Côte d’Ivoire and Central African Republic. Bayobab also acquired the fibre network of MTN Zambia in a sale-and-leaseback transaction to complete the first milestone in the structural separation of fibre assets under Ambition 2025.
Bayobab reinforced its network with specialised routes, notably the East to West Africa corridor, which bolsters terrestrial fibre for countries along its path. In the subsea fibre business, Bayobab closed the year with the landing of the 2Africa subsea cable in Ghana in November 2023, which was followed by the Nigeria landing post year end, in February 2024.
The Group’s EBITDA margin in constant currency terms and excluding the effects of once-off items declined by 1.2 pp to 41.5%*.
The Group’s reported EBITDA margin before once-off items was 40.9% compared to 43.9% in December 2022. There was a benefit to EBITDA margin of 0.2pp arising from the capitalisation of some costs of the renewed ECW contract agreement in fintech .
The 2023 EBITDA figure included a number of non-operational items totalling a net -R1 570 million. This comprised of a gain on disposal of SA towers of R76 million, impairment of assets in Afghanistan of -R900 million and the impairment of Sudan fixed assets of R 746 million.
The Group’s overall underlying margin in 2023 was supported by the focused execution of our expense efficiency programme where we realised R2.6 billion in expense efficiencies, with the largest savings recorded by MTN SA and MTN Côte d’Ivoire.
Impacts of restatements and revision of unrealised forex losses in MTN Nigeria results
Included in MTN Nigeria’s FY 2023 results released on 29 February 2024 – and reported in a Group SENS announcement published on 1 March 2024 – was an update relating to restatement of its IFRS 16 leases and IAS 21 effects of changes in foreign exchange rates. In this regard, MTN Nigeria's results included a restatement of its financial results for the year ended 31 December 2022 financial statements to reflect unrealised forex impacts, lease term reassessment and comparison to current period presentation.
In terms of the key impacts for MTN Group, the FY 22 opening total equity balance was restated lower by R2.4 billion, to reflect the impact of the MTN Nigeria restatements relating to the financial periods from 2019 to 2021. FY 22 PAT for the Group was restated lower by R407 million, resulting in a closing total equity at 31 December 2022 of R119.6 billion (from R122.3 billion previously). MTN Nigeria’s restatements reduced Group FY 2022 earnings per share (EPS) and headline EPS (HEPS) by approximately 17 cents each.
The abovementioned restatements would have had the effect of reducing EPS reported in H1 2023 by 216 cents and HEPS by 217 cents. It would have reduced both diluted EPS and diluted HEPS by 212 cents.
In our Q3 2023 trading update, released on 7 November 2023, we outlined the impacts of revision of unrealised forex losses in MTN Nigeria, reducing the EPS reported in H1 2023 by 65 cents and HEPS by 66 cents. It would have further reduced each of fully diluted EPS and fully diluted HEPS by 64 cents.
Consequently, the combined effect of the restatement and revision of unrealised forex losses on H1 2023, would have been to reduce EPS by 282 cents to 229 cents, and HEPS by 282 cents to 260 cents. They would have further reduced each of fully diluted EPS and fully diluted HEPS by 276 cents and 277 cents, respectively.
The above effects had a positive impact of 4 cents on H1 2023 Group Adjusted HEPS (AHEPS).

Resilient underlying earnings performance
For 2023, basic EPS decreased by 78.5% to 227 cents ( restated 2022: 1 054 cents). 2023 EPS were impacted by impairment losses that mainly relate to plant and equipment and remeasurement of non-current assets held for sale totalling approximately -40 cents; an impairment loss on remeasurement of disposal groups of -50 cents and net loss on disposal of property, plant and equipment and intangible assets of -1 cents. The impacts were offset by a net gain on the disposal of SA towers of 3 cents.
Reported HEPS decreased by 72.3% to 315 cents (2022: restated: 1 137 cents). HEPS were negatively impacted by net non-operational and once-off items amounting to - 888 cents (2022: restated - 192 cents). These include hyperinflation adjustments of -150 cents (2022: 125 cents), foreign exchange losses of -715 cents (2022: restated -209 cents), divestments of nil (2022: - 24 cents), remeasurement of deferred tax asset of nil (2022: - 65 cents) and other non-operational items of - 23 cents (2022: - 19 cents).
The substantial devaluation of naira against the US dollar had a meaningful impact on our reported results. Within the aforementioned 715 cents of forex losses, is 593 cents from Nigeria.
AHEPS declined by 9.5% to 1 203 cents.
We continued investing in network capacity expansion, with a R 63.6 billion spent on capex on an IFRS 16 basis, a 12.0% YoY increase. Capex (ex-leases) was up by 7.6% to R41.1 billion, which includes a hyperinflation impact of R1.0 billion (2022: R857 million). Also included in capex (ex-leases) was R2.7 billion arising from the capitalised costs of the renewed ECW agreement in fintech. Capex intensity (e x-leases) was 18.6%, compared to our medium-target range of 15-18%. In the period, we rolled out 3 319 3G, 5 356 4G and 2 251 5G sites.
Group operating free cash flow (OpFCF) decreased by 6.1% to R38.5 billion. Adjusting for licence renewals and spectrum acquisition in SA and Nigeria, OpFCF would have been R45.9 billion.
ROE (adjusted for non-operational items, including hyperinflation) increased by 0.2pp to 24.4% (2022: restated 24.2%), reflecting the resilience of our business in a volatile macroeconomic environment.

In addition to signing the definitive agreements with Mastercard for a minority investment into MTN Group Fintech, we also made pleasing progress in the execution of the portfolio optimisation focus of our Ambition 2025 strategy.
Sale of MTN Afghanistan to Investcom AF received regulatory approval
On 21 February 2024 all conditions precedent were finalised in relation to the sale of 100% of the shares in MTN Afghanistan to Investcom AF and accordingly, the sale has now been completed.
MTN Group is committed to an orderly handover in Afghanistan and has agreed a six-month transitional services agreement with Investcom AF. We believe that this transition will serve the best interests of MTN Afghanistan, its dedicated staff, valued customers and its broader stakeholders.
Exit of smaller WECA markets
MTN and Telecel entered into a share purchase agreement for the acquisition of MTN’s equity interests in MTN Guinea-Bissau and MTN Guinea-Conakry. The agreement was reached in December 2023 and is subject to a number of conditions precedent. Telecel, an established telecoms operator with a significant presence in Africa, is well positioned to drive the growth and further development of these operations and contribute to technological and economic progress in these markets.
As we advance through this transition, MTN is focused on ensuring a smooth and seamless transition for our customers, employees and all other stakeholders. Further updates regarding this transaction will be provided as appropriate
Creating shared value remains a key pillar of our Ambition 2025 strategy. With ESG at the core, it underpins our belief that MTN has an authentic responsibility to play a positive and meaningful role in creating a more sustainable and inclusive world.
We made significant progress against our ESG KPI Index. This was reflected in improved scores in Sustainalytics from ‘26.2’ to ‘21.7’ within medium risk category – with Sustainalytics citing MTN as a Company that has ‘strong overall management of material ESG issues’. MTN also received a ‘B’ rating for Carbon Disclosure Project, a two‑level increase compared to the previous year’s score of ‘C’ and higher than the Africa regional average of ‘B-’.
Doing for planet

We achieved a 13.1% absolute reduction in Scope 1 and 2 emissions (tCO2e), exceeding our 2023 target of 7.5% (excluding MTN South Africa); including MTN SA, we saw a 41.8% reduction due to a shift in emissions from Scopes 1 and 2 to Scope 3. This was driven by tower assets shifts between MTN SA and IHS, following the sale and lease back agreement between the two entities.
We continue to review targets with the Science-Based Targets Initiative (SBTi) given the asset and portfolio shifts to ensure we meet our target milestones. We are prioritising the reduction of Scope 3 emissions with 20% of our suppliers by spend having committed to setting their own emission reduction targets in line with SBTi by 2026. Our focus on energy efficiency and green energy initiatives remain a key driver in reducing emissions.
Doing for people
Diversity and inclusion are fundamental to MTN’s values, and we continue to advance gender equality with women representing 40% of our workforce (2022: 40%); on track to meet our 2030 target of gender parity. Beyond total representation, we are closely tracking key dimensions against our 2025 targets; such as women in leadership (28% against 2025 target of 30%) and women in technology (24% against 2025 target of 21%). We remain focused on fostering an environment where women are meaningfully supported to thrive, grow and contribute to our collective success.
We are dedicated to advancing broadband internet access in rural and remote areas, a pivotal stride toward fostering digital and financial inclusion. We have achieved broadband coverage of 89.2% (2022: 87.8%) against target of 95% coverage by 2025. This expansion has brought connectivity to an additional 8.4 million people in 2023 and investment in deployment of 6.6k sites in rural areas across our operations.
Our social and economic contribution made a meaningful impact on lives and livelihoods in our markets; this amounted to approximately R159 billion for 2023. In further aligning with national and continental priorities during 2023, we invested more than R195 million in corporate social investment programmes across our host nations. This made an impactful and meaningful contribution to the communities we serve.
Our flagship initiative, the MTN Skills Academy, has been launched to empower individuals across the continent to participate in the economies as producers, consumers, and innovators in digital technologies, among other socioeconomic priority areas. With a presence in eight markets, our academy offers basic digital courses and specialised skills training, paving the way for job opportunities and economic empowerment.
Doing it right
As part of our commitment to create and protect value for our partners and stakeholders, MTN Group’s Reputation remained stable year-on-year, with stakeholders rating it at a Reputation Index Survey score of 80.0 (2022: 79.8). This is above the Ambition 2025 target of 75 and outstrips most international reputation index benchmarks.
To support the widespread adoption of the new investor-focused standards, by the International Sustainability Standards Board, IFRS S1 and IFRS S2, MTN Group have pledged to begin the journey of adopting these Standards. We see the embedment of the IFRS Sustainability Disclosure Standards as an opportunity to better understand our sustainability-related risks and opportunities and to streamline our sustainability reporting processes to meet the needs of our stakeholders.
In line with policy, the Board has declared an ordinary final dividend of 330cps (2022: 330cps).
Listed Opcos published FY 2023 results
The published annual results of our listed Opcos can be viewed at:
https://www.mtn.ng/investors/financial-reporting/?report_cat=annual-results
https://www.mtn.co.ug/investors/financial-reports/
https://www.mtn.co.rw/investors-financial-reporting/
MTN South Africa
Navigating a challenging South African trading environment
MTN SA delivered a resilient performance in a challenging FY 2023, with an attestable quarterly recovery in key indicators, demonstrating the benefits of its investment in network resilience.
South Africa’s economy grew by just 0.1% in Q4, bringing the full year growth to 0.6%. Inflation averaged 6.0% in the year (2022: 6.8%), although the trend moderated in H2, recording 5.1% in December 2023 (December 2022: 7.2%). The US dollar appreciated by an average of 12.5% against the rand, which impacted the cost of imports and also fed into inflation. 2023 experienced more intense power outages with a total of 335 loadshedding days in 2023, compared to 205 in 2022.
Against this backdrop, MTN SA continued to invest in the resilience of its network, strengthening its operations and supported resilient quarterly progression in service revenue growth in key verticals, driven by its customer-centric commercial strategy execution.
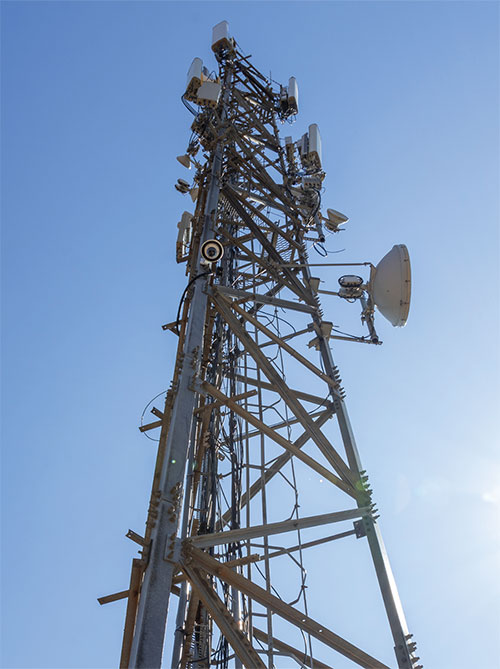
During the year, MTN SA invested R10.1 billion of capex (ex-leases), including its resilience plan to improve network availability in the context of increased loadshedding. By December 2023, MTN SA’s network availability had improved significantly and ahead of schedule, to approximately 95%. This translated to an improvement in customer satisfaction, with the Net Promoter Score (NPS) on network recording a notable increase. Our efforts have narrowed the gap to the competition propelling us to gain network leadership in key regions such Gauteng, Eastern Cape and KwaZulu Natal.
Network resilience supported progressive quarterly performance improvements
The improved network availability promoted and enhanced customer experience, enabling MTN SA to drive its commercial strategy to support revenue growth.
This was underpinned by a 2.4% increase in subscribers to 37.4 million, with net additions of 893 k for the year. The number of postpaid subscribers grew by 4.4% for the year, reaching 4.1 million (excluding telemetry). Prepaid customers increased by 0.3% to 28.3 million.
Data remained the primary driver of growth, accounting for 47.8% of MTN SA’s service revenue and growing by 7.4% for the year. This was driven by an 8.0% increase in active data subscribers to 20.4 million, as well as a 27.7% growth in network traffic.
An active prepaid data subscriber now consumes an average of 3.0 GB of data a month (up 15.0% YoY); an active postpaid data subscriber uses an average 16.5 GB (up 29.6% YoY).
Consumer postpaid service revenue grew by 2.8% for the year, supported by the sustained uplift in data consumption and price-up initiatives. MTN SA delivered steady growth in the residential business, introducing new home propositions (including MTN Fibre) while expanding and diversifying the sales channel. This sustained the customer base and revenue growth.
Consumer prepaid service revenue decreased by 2.8%. In Q4, the softer decline of 1.8% showed a pleasing improvement in trend versus the 2.0%, 2.3% and 5.0% declines recorded in Q3, Q2 and Q1 respectively. Focusing on customer experience excellence, we have made significant progress in product rationalisation and improvements in customer journeys.
Outgoing voice revenue declined by 12.1% for the year ( 11.9% decline including incoming voice revenue). However, the trajectory over the year was encouraging, with the Q4 decline of 9.9% showing a notable improvement compared to the declines of 10.7%, 11.7% and 16.0% in Q3, Q2 and Q1 respectively.
In addition to the quarterly improvement in network availability, this improvement in voice performance was also enabled by an acceleration in Xtratime penetration, which reached 36% in Q4, up from 26% in Q3, 25% in Q2 and 24% in Q1.
CVM initiatives continued to gain traction with personalised bundle offerings now available on 12 platforms. CVM bundle penetration progressed steadily through 2023, rising to 29% in Q4 2023 (Q4 2022: 22%).
The enterprise business continued to achieve double-digit service revenue growth, with 15.9% for the year. This was driven by the ICT business, while the digital mobile advertising and core mobile businesses continued to benefit from strong data product propositions as well as distribution channel expansion.
The
wholesale
business sustained double-digit revenue growth, with an increase of
13.4%
(including incoming voice revenue) for the year building on a strong base.
Excluding incoming voice, wholesale revenue increased by 20.9%. MTN SA’s national roaming revenue rose by
26.1%
, driven by Cell C revenues as well as the steady scaling of the multi-year national roaming agreement with Telkom.
The fintech business grew service revenue by 14.7% . We expanded our platform capabilities significantly in H1 including small to medium enterprise financial solutions and launched MoMo 2.0 in Q3. We also focused on driving advanced services, encompassing international remittances, Point of Sale and funeral cover to name a few.
MTN SA’s EBITDA declined by 5.8%, including the once of gain from the disposal of SA towers; excluding this effect, EBITDA declined by 4.4% YoY. The EBITDA margin of 36.1% was 3.1pp lower YoY (down 2.6pp to 35.9%, excluding the gain on disposal of SA towers). The result was also impacted by VSP provisions of R162 million, which when further adjusted for, FY 2023 EBITDA would have decreased by 3.6% and margin would have been 2.2pp lower to 36.3% (i.e. excluding both gain on from disposal of SA towers and impact of VSP provision).
EBITDA was impacted by topline pressures, as well as higher power and other network-resilience-related costs. We continued with our cost optimisation drive to safeguard profitability and cash flows, underpinned by the expense efficiency programme. This enabled us to absorb some of the macroeconomic shocks experienced during the year.
MTN SA deployed capex of R10.1 billion (ex-leases), at an intensity of 19.5%, which enabled the investment in network resilience and capacity. Including IFRS 16 leases, capex was R15.7 billion. During the year, MTN SA delivered R5.4 billion in cash release initiatives, which helped mitigate the pressure on cash flows.
Driving ESG priorities in South Africa
MTN’s commitment to holding ESG at the core of its strategy, saw important delivery against our 2021 pledge with the SBTi, whereby the Company committed to achieving net zero emissions by 2040, and we remain on track to meet our ambitions.
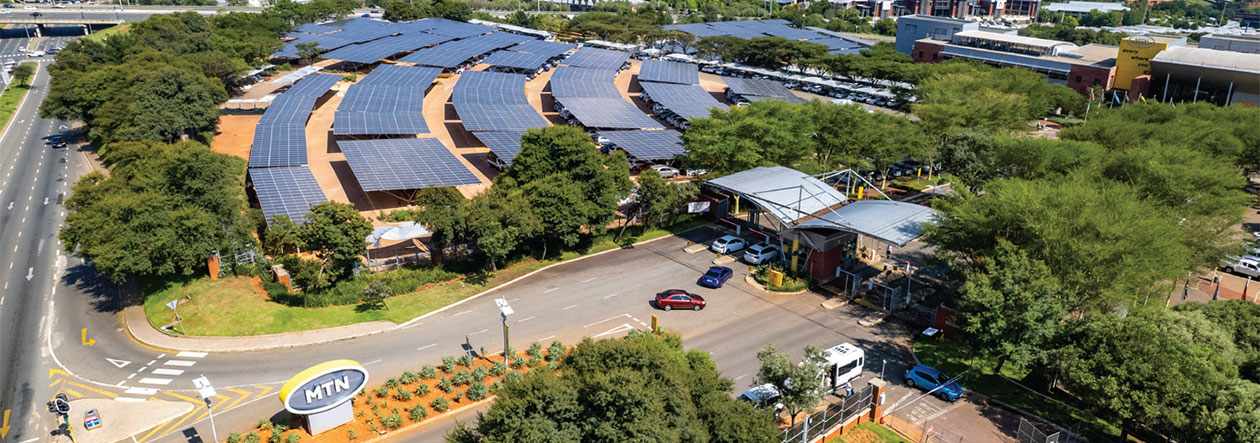
The year also saw the energisation of the 4.9MW solar park, which houses five different generation technologies – solar, battery storage, gas trigeneration, and diesel generators, which will help to reduce MTN SA’s carbon emissions while also ensuring less reliance on the municipal grid.
The MTN SA Foundation continues to play a pivotal role in addressing socioeconomic challenges through initiatives that focus on education, digital skills, entrepreneurship, arts and culture and the promotion of women and youth in the digital economy. We are proud with the launch of the SA offering of the MTN Skills Academy which provides digital and financial skills training as a tool to empower young people while helping increase employment prospects. The MTN Online School completed a successful API integration with its partners, Siyavula, which now sees 1 million learners accessing digital education content through MTN.
MTN SA Outlook
The pressure on the prepaid market in South Africa is anticipated to remain in 2024, while base effects are expected to impact growth in the wholesale segment. MTN SA will focus on consolidating gains driven by the network resilience plan as well as ongoing implementation of our commercial initiatives, Xtratime acceleration, price optimisation and CVM to enhance customer engagement.
MTN SA is well positioned to execute on its priority to return topline growth and EBITDA margin to targeted medium-term ranges. As part of our revenue acceleration initiatives, we have made a deliberate effort to front-load the investment into the device market. While this will place some pressure on our margin performance in the short term, it will strengthen our market position and safeguard our revenue share.
In order to help buffer MTN SA margins from ongoing inflation and cost pressures, price increases were implemented in postpaid in February 2024. We will also continue to implement price optimisation initiatives and increases in our other business units.
Given the continued challenges with loadshedding and the success of the network investment, MTN SA will continue the work to complete the resilience programme in Q1 2024 as well as explore avenues to drive further resilience and power efficiencies in its network.
The operating environment is expected to remain challenging, with the economic growth outlook muted and persistent pressure on consumer disposal income. However, due to our ongoing investment into developing a resilient organisation, we are well positioned to charter the uncertain terrain and continue with our trajectory of continuously improving performance.
MTN Nigeria
MTN Nigeria delivered a resilient set of annual results – published on 29 February 2024 – in a challenging environment and impacted by significant devaluation of the local currency. In this context, the operating performance remained solid with good underlying commercial momentum.
Service revenue was up 22.1%* in line with medium-term growth guidance , with a growth acceleration in Q4 to 25.0%*. The main drivers of growth was data revenue, with voice growth remaining solid.
Voice revenue increased by 10.2%*, benefiting from the expansion of the mobile subscriber base and higher usage resulting from CVM activities and redesigned voice offerings.
Data revenue rose by 38.6%* (up 48.7%* in Q4) driven by revamped data bundle offerings and considerable investments. This underpinned a 28.5% increase in data usage to 8.2 GB and 44.9% growth in traffic on the network. As at December 2023, MTN Nigeria’s 4G network covered 81.5% of the population (2022: 79.1%) and 5G covered 11.3%. Smartphones penetration increased to 55.6%, up 4.1pp YoY.
Fintech revenue increased by 3.7%*, largely attributable to Xtratime. MTN Nigeria added 3.3 million active wallets to close the year at 5.3 million, despite the challenges experienced due to NIN requirements for KYC introduced in Q4. MoMo PSB revenue growth of 8.1%*, with an expansion in the ecosystem where active agents and merchants grew to over 326k (up 46.0% YoY) and 324k, respectively. Transaction volume grew by 49.2% YoY, underpinned by the key ecosystem metrics, which all accelerated in Q4.
The digital business, which recorded revenue growth of 65.6%*, gained traction through the optimisation of its services. This underpinned the increase in the number of active users of digital services, with rich media subscriptions — excluding ayoba — growing by 57.2% to reach about 8 million. Ayoba, saw a 65.6% increase in monthly active users to reach 8.6 million by year end.
Revenue from the enterprise business rose by 45.3% *, on increased uptake of communication and ICT services by enterprises and public sector institutions. Mobile and fixed connection services were the main revenue drivers, fuelled by onboarding of new customers, enhanced offers and growing usage.
The combined effects of naira devaluation and the once-off provision for the FIRS VAT assessment, resulted in operating expenses (opex) growth of 39.8%. Excluding these effects, opex increased by 24.5%*.
MTN Nigeria recorded EBITDA growth of 14.2%*, while the EBITDA margin declined by 3.6pp* to 49.7%*. The result was impacted by naira devaluation, higher general inflation and energy costs, and the introduction of the 2023 Finance Act VAT on tower leases. Adjusting for the effects of naira devaluation (2.8pp*) and the provision for FIRS VAT assessment (0.9pp*) in particular, the EBITDA margin for FY 2023 would have been 53.4%* (Q4 2023: 53.8%*).
Overall, MTN Nigeria recorded a loss after tax of R2.4 billion. Adjusting for net forex losses, PAT would have been R11.6 billion (down by 3.4%). Further adjusting for the impact of naira devaluation in opex and the once-off provision for the FIRS VAT assessment, PAT would have been up by 12.0% to R13.5 billion. MTN Nigeria generated strong adjusted free cash flow of R20.1 billion, up 22.0%.
Southern and East Africa (SEA) region
The SEA region delivered service revenue growth of 17.4%* YoY, supported by strong growth in data (up 24.3%*), fintech (up 21.4%*) and voice revenue (up 11.4%*) as well as an increase in subscriber numbers by 7.5% YoY, to 39.2 million. The annual blended inflation in SEA averaged 10.0%, compared to 14.3% in 2022.
MTN Uganda published annual results on 6 March 2024 and reported service revenue growth of 16.1%* YoY, underpinned by continued momentum in voice (up 11.6%*) and solid performances from data (up 21.6%*) and fintech (up 17.6%*). The subscriber base grew by 13.3% to 19.5 million. The performance was boosted by the customisation of customer packages through improved CVM offers as well as a revised approach to our regional distribution network, which drove higher traffic.
Data revenue was supported by YoY increases of 22.5% and 49.6% in active data users and data traffic respectively. The increase in data consumption came on the back of improvements in network speeds following the additional spectrum deployment in the 700MHz, 2300MHz and 2600MHz bands allowing for a better user experience.
Fintech active users were up 10.5% to 12.1 million, which drove transaction volume growth of 30.8% to 3.4 billion. MTN Uganda’s ecosystem development was also pleasing, where the active agent and merchant networks expanded by 10.0% (to 170k) and 68.7% (to 292k), respectively.
MTN Uganda’s EBITDA increased by 16.2%*. The EBITDA margin held steady at 51.3%*, underpinned by solid topline growth and focused operational efficiency.
MTN Rwanda , which published annual results on 15 March 2024 , reported 6.5% YoY growth in the subscriber base to 7.3 million despite a slowdown in economic growth, elevated inflation and regulatory hurdles. Service revenue grew by 11.3%*, owing to topline growth in data (up 21.5%*), fintech ( up 30.3%*) and enterprise ( up 15.1%*).
Data revenue sustained its strong growth momentum, driven by a 14.3% increase in active data users and a 20.8% YoY increase in data traffic – this was boosted by the launch of MTN Rwanda’s own 4G network during the year. Commercially, the business drove user engagement and usage through introduction of our affordable, competitive and customised data packages.
Fintech revenue maintained solid YoY development underpinned by a 13.9% expansion of the active user base and 30.3% growth in transaction volumes to 1.9 billion. MTN Rwanda’s advanced service revenue rose by 69.5%, supported by continued broadening of its agent and merchant bases (up 8.6% and 138.8%, respectively).
MTN Rwanda reported EBITDA growth of 3.6%* and an EBITDA margin of 46.3%* ( down 3.5pp YoY). EBITDA was impacted by a zero-MTR directive from the regulator in Q4, which affected interconnect revenue. There was some mitigation from the launch of MTN Rwanda’s own 4G network in July 2023 , which reduced data cost of sales and enabled more efficient network expansion.
Overall, the SEA portfolio reported a 0.5pp* decline in the blended EBITDA margin to 46.0%*.
West and Central Africa (WECA) region
The WECA region delivered service revenue growth of 13.5%* largely driven by data (up 24.7%) and fintech (up 28.6%). Active data subscribers increased by 11.5% to 35.7 million and active MoMo users increased by 7.4% to 35.1 million. The average blended inflation for the region was 17.4% in 2023, compared to 14.1% in 2022. Excluding Ghana, the WECA region’s service revenue growth was 4.1% compared to blended inflation of 5.0%.
MTN Ghana , which published annual results on 28 February 2024 , continued to be a meaningful contributor to the Group’s performance. Against a macro environment that remained challenging – with inflation averaging 40.3% in the year, and the cedi depreciating by 34.5% against the US dollar in 2023 – this outcome was achieved through well-executed commercial strategies, pricing initiatives and focused investment in the network.
Service revenue grew by 35.0%* supported by a solid voice performance, and strong growth in data and fintech notwithstanding the impacts of a regulatory directive to block non-compliant SIMs from the network.
Voice revenue increased by 9.0%*, supported by optimised and customer-centric CVM initiatives, pricing initiatives and improved network coverage. The contribution of voice to total service revenue declined from 33.1% to 26.8%, as customer behaviour continued to evolve in line with global trends.
Data revenue rose by 51.3%*, a robust data performance driven by a 14.0% YoY increase in active data subscribers as well as data pricing initiatives and well-positioned offers in the market. Data demand continued to grow as MB consumed per active user per month grew by 19.3% and data traffic increased by 36.1%. The growth in demand was supported by various commercial interventions coupled with investments in network infrastructure to offer high-speed data services to homes and mobile subscribers.
The fintech business reported revenue growth of 46.4%* with pleasing growth in active users (up 20.1%). The outcome was further supported by partnerships with various financial institutions, agents, and merchants which enabled continued expansion of the fintech ecosystem and strong growth in advanced services, whose contribution to fintech revenue grew to 24.8% from 21.8% in 2022.
Digital revenue decreased by 4.5%* YoY, however due to ongoing efforts to enhance customer experience, as well as to rationalise the digital product portfolio, H2 growth accelerated to 18.2%. The number of active digital subscribers increased by 28.6% YoY, reaching a total of 4.6 million. Our primary focus is on improving the myMTN application and expanding the music and game offerings on ayoba.
EBITDA increased by 39.6%* YoY, with the margin increasing by 1.9pp to 58.4%*, due to the topline growth and ongoing efficiencies. There was a benefit to the EBITDA performance from reversing provisions relating to the TMTA agreement, which was only renewed in December 2023. Adjusting for this, would result in an EBITDA margin of 56.1%*.
MTN Côte d’Ivoire has had a tough year with a stable service revenue outcome (up marginally by 0.1%* YoY). The regulatory environment remained challenging, exacerbated by increased price-based competition in the market.
The result was negatively affected by a decline in voice revenue (down 6.1%*) in the market driven by the removal of the pricing framework by the regulator in April 2023, which led to price dilution. Data revenue growth also slowed (up 10.1%*) due to longer lead times in network rollout arising from tower lease contract renewals and equipment logistics bottlenecks.
Fintech revenue increased by 0.8%*, impacted by lower MAUs (down 29.3% to 4.8 million). This was due to interventions to clean up the user base. More encouragingly, development of the overall ecosystem remained steady with transaction volumes up by 18.0% to 1.1 billion.
More broadly, price repair initiatives in the sector are key focus in Côte d’Ivoire, with engagements underway with relevant authorities in the country. These discussions along with aggressive commercial interventions are anticipated to drive a steady recovery of the business over time .
MTN Côte d’Ivoire’s EBITDA margin declined slightly by 0.2pp* to 32.9%*, reflecting the macroeconomic and competitive pressures on the business. The impacts were mitigated by expense efficiencies realised in the year .
MTN Cameroon reported solid service revenue growth of 10.9%* and maintained leading market share in a challenging and highly competitive environment. CVM initiatives continued to drive solid growth in data (up 20.1%*) and fintech (up 25.4%*) revenue, despite increased pricing competition in the market. The EBITDA margin for MTN Cameroon improved by 2.2pp* to 37.8%*, driven by strong topline growth and expense efficiencies.
WECA reported a 22.8%* increase in EBITDA and a blended EBITDA margin of 40.8%*, up by 3.0pp*. Excluding MTN Ghana, the WECA markets reported a 1.3pp* increase in the blended EBITDA margin to 30.8%*.
Middle East and North Africa (MENA) region
The difficult trading conditions in the MENA region affected service revenue, which fell by 8.7%* YoY. Excluding MTN Irancell, the overall subscriber base fell by 23.3% to 11.6 million and the number of active data users fell by 30.2% to 3.6 million.
MTN Sudan’s service revenue decreased by 12.3%* YoY. The situation in the country remained volatile in 2023 given the ongoing conflict in the country and high inflation. As a result, EBITDA margin declined by 21.7pp* to 30.6%*. These effects were mitigated by revenue recovery initiatives, which were supported by expense efficiency measures as well as the restoration of the network where it was safe to do so.
MENA reported a blended EBITDA margin of 29.5%*, down by 12.2pp*, mainly affected by the conflict in Sudan.
Associates, joint ventures and investments
Telecoms operations
MTN Irancell , our equity-accounted JV, delivered service revenue growth of 34.5%*, supported by increased data usage. Solid data revenue of 15.9%* was supported by a 9.8% increase in usage, higher effective pricing and a 6.1% increase in active data subscribers. The EBITDA margin declined by 0.5pp* to 41.1%* due to opex pressures as a result of currency depreciation.
E-commerce investments
The Iran Internet Group continued its strong performance in the twelve months to December 2023. Ride-hailing app Snapp remained the market leader, ranking among the top ride-hailing apps globally and reaching 4.7 million daily rides compared to 3.7 million rides in 2022. Last-mile delivery service Snappbox also remained the market leader with revenue up 97% YoY and daily orders increasing by 28% YoY to almost 390k. Food delivery app Snappfood grew revenue by 94% YoY and remained the largest player in the country.
Electronic Communications Amendment (ECA) Bill in South Africa
The Department of Communications and Digital Technologies in South Africa published an invitation to comment on the proposed ECA Bill (2022), in June 2023. It proposes amendments to the prevailing Electronic Communications Act (2005) in relation to spectrum, roaming, MVNOs, rapid deployment of infrastructure, facilities access and competition assessments. MTN SA has submitted its comments on the proposed amendments and will continue to closely monitor the progress of the bill.
High demand spectrum (HDS) in South Africa
Following the auction for HDS in March 2022, MTN SA secured a total of 100 MHz of HDS for an amount of R5.2 billion and MTN paid R3.3 billion in FY 2022, after the spectrum licence became effective in July 2022. MTN settled the balance of R1.9 billion during H2 2023 and has received the remainder of the spectrum, which has been freed up for use by MTN SA. MTN SA has already started to deploy the spectrum nationally. The next round of auctioning HDS that have been proposed by ICASA is still subject to further discussion.
MTN Nigeria appeals VAT assessment
In 2018, the Attorney General of the Federation and Minister of Justice (AGF) demanded approximately US$2 billion in tax arrears from the Company. In 2020, the AGF withdrew its demand against the Company and referred the matter to FIRS for resolution. After a series of engagements, the FIRS reduced the initial assessment to US$135.7 million, representing a principal tax liability of US$47.8 million and an interest and penalty of US$87.9 million. To clarify the interpretation of the VAT Act's provisions concerning the tax treatment of the transactions that led to the assessments, MTN Nigeria filed an appeal at the Tax Appeal Tribunal (TAT).
On 20 October 2023, the TAT upheld the principal liability of US$47.8 million and set aside the interest and penalty charges of US$87.9 million. Although MTN Nigeria made full provision for the tax liability in line with IAS 37, it has appealed the decision of the TAT and awaits the outcome. MTN Nigeria remains committed to meeting its tax obligations.
Update on Anti-terrorism Act (ATA) litigation
We note the following updates and developments regarding ongoing ATA legal complaints filed in the US.
Cabrera v Black & Veatch , filed on 27 December 2019 on behalf of American service members and civilians, and their families, who were killed or wounded in Afghanistan between 2009 and 2017. MTN filed a motion to dismiss, challenging the jurisdiction of the US court over the MTN defendants, which do not operate in the United States of America, and asserting that the complaint does not allege any conduct by the MTN defendants that violated the ATA.
On 30 July 2021, the magistrate judge issued a report and recommendation (R&R) recommending that the case against the MTN defendants be dismissed because the court lacks jurisdiction over them.
On 27 November 2023, the plaintiffs filed an application for leave to amend their complaint. MTN is opposing the application. Further decisions on MTN’s motion to dismiss, which remains pending until the district judge confirms or vacates the R&R will be made only after the application to amend has been decided.
Long v MTN , filed on 28 July 2023 on behalf of the families of American service members who were killed in Afghanistan between 2013 and 2014 and one American journalist who was abducted in Syria between 2012 and 2013. MTN is reviewing the details of the complaint and is consulting its advisers, but we note that the claim is predicated on the same factual allegations as Zobay (update included in Q3 2023 results release). MTN will file a motion to dismiss in due course.
MTN conducts its business in a responsible and compliant manner in all its territories and will defend its position where necessary.
Resilience of our business underpins continued strategy execution
Our operating context in the period ahead is expected to remain challenging and uncertain, given the upward pressure on inflation across our footprint, as well as ongoing volatility in local currency markets. Geopolitical conditions globally and in some of our markets, are also anticipated to remain a factor affecting our trading environment.
Against this backdrop, we are encouraged by the resilience we have built into our business and will continue to execute our commercial and strategic initiatives to deliver on our Ambition 2025 objectives.
Well positioned to sustain our solid operational momentum
Driving further recovery in MTN SA
MTN SA has largely completed its network resilience programme, which has significantly improved network resilience that underpins its operations. The business has, therefore, set a strong foundation to accelerate growth over the medium-term. Given the continued challenges with loadshedding and the success of the network investment, MTN SA will continue the work to complete the resilience programme in Q1 2024 as well as explore avenues to drive further resilience and power efficiencies in its network.
From an operational perspective, MTN SA will focus on its commercial initiatives – including price optimisation across its business units – to drive growth. In the short-term, the Opco will also accelerate its handset and device strategy to support its data ambitions. We expect this to impact MTN SA’s EBITDA margin and temporarily slow its recovery profile in the near term.
Coupled with a focused drive on efficiencies, MTN SA will continue to prioritise returning topline growth and EBITDA margin to targeted medium-term ranges over time.
MTN Nigeria focused on operational execution; restoring earnings and strengthening the balance sheet
MTN Nigeria remains committed to maintaining sustaining commercial momentum and accelerating service revenue growth, improving the profitability of the business and strengthening the financial position. Engagements with regulatory authorities on much needed tariff increases for the industry remain ongoing and a priority, and there is comprehensive work in progress to reduce and mitigate the foreign exchange exposures impacting its business including tower operating costs.
The business will execute and unlock efficiencies to drive operating leverage, with emphasis on reestablishing earnings growth, sustaining strong free cash flow generation and restoring its reserves and balance sheet position.
MTN Ghana leads robust growth in our Markets
Our broader Markets portfolio remains on a solid overall footing to capture growth opportunities. This is led by MTN Ghana, which will continue to invest in its connectivity business and development of its platforms. We maintain our guidance for MTN Ghana, of high-twenties service revenue growth and stable margins, underpinned operational excellence and execution.
Sustaining traction and progress in our fintech strategy
We are encouraged by the momentum in our fintech business, despite competitive and regulatory headwinds in some markets. Our priority is to drive continued expansion of ecosystem, underpinned by our extensive footprint, to support growth in usage and monetisation. MoMo PSB in Nigeria showed some encouraging momentum in Q4, particularly in its key ecosystem metrics. We will sustain the traction in our business through focused commercial interventions and leveraging our distribution to accelerate the scaling of the business.
The signing of definitive agreements with Mastercard to a minority investment in MTN Group Fintech is an exciting milestone in our strategy, which complements the larger commercial agreements already concluded in August 2023. These will support the continued development and growth of technology and infrastructure to drive financial inclusion across the African continent. We have planned some commercial launches focused on card issuance and acceptance across the footprint.
This relationship is a key enabler for the acceleration of our fintech business' payments and remittance services. MTN will continue to explore opportunities for other value enhancing partnerships and investments, subject to market conditions, with strategic partners and long-term investors.
Focus on our financial resilience and disciplined capital allocation
Our commercial endevours will continue to be supported by our commitment to driving expense efficiencies. We continue to pursue further gains over the medium term with a target of R7-8 billion in expense efficiencies targeted over the next three years.
The work we have done to fortify our financial position has enabled us to navigate the pressures from the external environment on our business. We will keep a focused discipline on capital allocation framework that underpins our growth ambitions and prudent management of our leverage and liquidity positions. As mentioned, a key priority for the year ahead will be to strengthen MTN Nigeria margins and balance sheet resilience, including resolving for the longer term the negative equity position reported as at end of FY 2023.
Progressing our strategic priorities
One of our key focus areas will be to ramp up the monetisation of our platforms in line with our strategy, including advanced services in fintech. In ayoba, our main priority will be to scale digital advertising, as many more digital advertising formats and options are being launched to benefit from the increasing user base and engagement. The separation of our fibre assets is progressing well and we will continue to explore opportunities for strategic partnerships and further minority investments in our platforms.
The ongoing efforts in our localisation programmes – particularly Ghana and Uganda – is key to our agenda to create shared value in our markets as well as our broader asset realisation programme. In 2024, we will continue the work to meet our localisation targets in key markets.
The overall progress in optimising our portfolio has been encouraging, under challenging conditions, and the work will continue on the Group’s orderly exits from MTN Guinea-Bissau and MTN Guinea-Conakry.
Medium-term guidance
The elevated and ongoing volatility in our operating context presents increased headwinds on our business and material uncertainty to our near-term outlook. We are, however, encouraged by the underlying resilience and momentum in our business, as well as the relevance of our Ambition 2025 strategy to capture the structural growth opportunities in our markets.
Consequently, despite the short-term pressures on the business, we maintain our overall medium-term guidance framework with a simplification of the fintech measure, as outlined below:
Group service revenue: ‘at least mid-teens’ percentage growth in constant currency terms (unchanged).
MTN SA service revenue: mid-single-digit percentage growth from MTN SA (unchanged).
MTN Nigeria service revenue: ‘at least 20%’ growth in constant currency terms (unchanged).
Fintech revenue: ’high-20% to low-30%’ growth in constant currency terms (from ‘at least 20%’ of Group service revenue contribution by 2025). This framing has been simplified and aligned to the other revenue guidance metrics.
Holdco leverage: target ratio over the medium term of ‘below 1.5x’, with increased focus on faster reduction of non-ZAR borrowings and optimising debt mix (unchanged).
Adjusted ROE: improvement towards 25% (unchanged).
We previously announced the following changes to our Group Exco:
Jens Schulte-Bockum will step down from his role as Group Chief Operating Officer and the Group Exco when his fixed-term contract ends on 31 March 2024. He will continue to serve as a non-executive director on the boards of MTN South Africa, MTN Nigeria and Bayobab.
Selorm Adadevoh, currently MTN Ghana CEO, will succeed Jens in the role of Group Chief Commercial Officer, effective 1 April 2024. Although Selorm's new designation has been amended to better align with the Group Operating Model, he will join the Group Exco on the effective date and assume all of Jens' executive responsibilities. Stephen Blewett will assume the role of CEO of MTN Ghana, effective 1 April 2024, from his role as Operations Executive for Markets.
Notice is hereby given that a gross final dividend of 330 cents per share for the period to 31 December 2023 has been declared and will be paid out of revenue reserves. The number of ordinary shares in issue at the date of this declaration is 1 884 269 758 (including 518 089 treasury shares held by MTN Holdings, the 441 494 shares held by the 2016 MTN ESOP trust and 76 835 378 shares held by MTN Zakhele Futhi).
The dividend will be subject to a maximum local dividend tax rate of 20% which will result in a net dividend of 264 cents per share to those shareholders who bear the maximum rate of dividend withholding tax of 66 cents per share. The net dividend per share for the respective categories of shareholders for the different dividend tax rates is as follows:
These different dividend tax rates are a result of the application of tax rates in various double taxation agreements as well as exemptions from dividend tax.
MTN’s tax reference number is 9692/942/71/8. In compliance with the requirements of Strate, the electronic settlement and custody system used by the JSE Limited, the salient dates relating to the payment of the dividend are as follows:
Declaration date:
Friday, 22 March 2024
Last day to trade
cum
dividend:
Tuesday, 16 April 2024
First trading day
ex
dividend:
Wednesday, 17 April 2024
Record date:
Friday, 19 April 2024
Payment date:
Monday, 22 April 2024
No share certificates may be dematerialised or re-materialised between Wednesday, 17 April 2024 and Friday, 19 April 2024, both days inclusive. On Monday, 22 April 2024 the dividend will be transferred electronically to the bank accounts of certificated shareholders who make use of this facility. Shareholders who hold dematerialised shares will have their accounts held by the Central Securities Depository Participant or broker credited on Monday, 22 April 2024.
25 March 2024
Fairland
Business Group: Consist of internet service providers in Namibia, Kenya and Botswana
CPI: Consumer Price Index
CVM: Customer value management
DMTN: Domestic Medium-Term Note
GB: Gigabyte
GSM: Global System for Mobile communication
Holdco leverage: Holdco net debt (including MTN GC)/SA EBITDA + cash upstreaming
MB: Megabyte
NPS: Net Promoter Score
OTC: Over the counter
OTT: Over-the-top
P2P: Peer-to-peer
PB: Petabyte
PSB: Payment service bank
SIM: Subscriber Identity/Identification Module
Towerco: Tower companies
Definitions:
We are targeting capex (ex-leases) of R35-39 billion, based on current currency assumptions, for FY 2024 and capex intensity over the medium term in the 15%-18% range.
|
Headline earnings reconciliation |
|||||||
|
Rm |
IFRS reported 2023 |
Impairment of goodwill, PPE and associates1 |
Impairment loss on remeasurement of disposal group 2 |
Net loss (after tax) on disposal of SA towers3 |
Other 4 |
Headline earnings |
Hyper- inflation (excluding impairments)5 |
|
2023 |
|||||||
|
Revenue |
221 056 |
– |
– |
– |
221 056 |
(4 715) |
|
|
Other income |
324 |
– |
– |
(76) |
– |
248 |
– |
|
EBITDA |
88 780 |
851 |
900 |
(76) |
5 |
90 460 |
(543) |
|
Depreciation, amortisation and impairment of goodwill |
(42 268) |
– |
– |
– |
(42 268) |
4 992 |
|
|
Profit from operations |
46 512 |
851 |
900 |
(76) |
5 |
48 192 |
4 449 |
|
Net finance cost |
(39 069) |
– |
– |
– |
(39 069) |
456 |
|
|
Hyperinflationary monetary gain |
744 |
– |
– |
– |
744 |
(744) |
|
|
Share of results of associates and joint ventures after tax |
3 581 |
– |
– |
(10) |
3 571 |
(1 124) |
|
|
Profit before tax |
11 768 |
851 |
900 |
(76) |
(5) |
13 438 |
3 037 |
|
Income tax expense |
(7 751) |
– |
– |
20 |
– |
(7 731) |
453 |
|
Profit after tax |
4 017 |
851 |
900 |
(56) |
(5) |
5 707 |
3 490 |
|
Non-controlling interests |
75 |
(125) |
– |
32 |
(18) |
(772) |
|
|
Attributable profit |
4 092 |
726 |
900 |
(56) |
27 |
5 689 |
2 718 |
|
EBITDA margin |
40.2% |
40.9% |
|||||
|
Effective tax rate |
65.9% |
57.5% |
|||||
|
|
|||||||
|
Rm |
Impact of foreign exchange losses and gains6 |
IFRS 2 Charge due to Ghana localisation7 |
Disinvest- ments8 |
Deferred Tax Asset remea- surement9 |
Other non- operational items10 |
Adjusted 2023 |
% movement |
|
2023 |
|||||||
|
Revenue |
– |
– |
– |
– |
– |
216 341 |
5.8 |
|
Other income |
– |
– |
– |
– |
– |
248 |
652.2 |
|
EBITDA |
– |
– |
– |
– |
405 |
90 322 |
(0.4) |
|
Depreciation, amortisation and impairment of goodwill |
– |
– |
– |
– |
– |
(37 276) |
8.7 |
|
Profit from operations |
– |
– |
– |
– |
405 |
53 046 |
(5.9) |
|
Net finance cost |
23 311 |
– |
– |
– |
– |
(15 302) |
27.3 |
|
Hyperinflationary monetary gain |
– |
– |
– |
– |
– |
– |
– |
|
Share of results of associates and joint ventures after tax |
81 |
– |
– |
– |
– |
2 528 |
14.8 |
|
Profit before tax |
23 392 |
– |
– |
– |
405 |
40 272 |
(13.5) |
|
Income tax expense |
(7 071) |
– |
– |
– |
– |
(14 349) |
(17.9) |
|
Profit after tax |
16 321 |
– |
– |
– |
405 |
25 923 |
(10.9) |
|
Non-controlling interests |
(3 394) |
– |
– |
– |
– |
(4 184) |
(18.0) |
|
Attributable profit |
12 927 |
– |
– |
– |
405 |
21 739 |
(9.4) |
|
EBITDA margin |
41.7% |
||||||
|
Effective tax rate |
35.6% |
| * | 2022 – depreciation, net finance costs and deferred tax thereof have been restated as they were incorrectly accounted for in terms of IFRS 16. |
|
Rm |
IFRS reported 2022 (restated*) |
Impairment of goodwill, PPE and associates1 |
Impairment loss on remeasurement of disposal group3 |
Net loss (after tax) on disposal of SA towers3 |
Other4 |
Headline earnings |
Hyper- inflation (excluding impairments)5 |
|
2022 |
|||||||
|
Revenue |
207 003 |
– |
– |
– |
207 003 |
(2 484) |
|
|
Other income |
412 |
– |
– |
(371) |
– |
41 |
(8) |
|
EBITDA |
90 348 |
184 |
753 |
(371) |
(183) |
90 731 |
(851) |
|
Depreciation, amortisation and impairment of goodwill |
(35 752) |
625 |
510 |
– |
(34 617) |
335 |
|
|
Profit from operations |
54 596 |
809 |
1 263 |
(371) |
(183) |
56 114 |
(516) |
|
Net finance cost |
(18 326) |
– |
– |
– |
(18 326) |
253 |
|
|
Hyperinflationary monetary gain |
1 251 |
– |
– |
– |
1 251 |
(1 251) |
|
|
Share of results of associates and joint ventures after tax |
3 369 |
– |
– |
(5) |
3 364 |
(1 174) |
|
|
Profit before tax |
40 890 |
809 |
1 263 |
(371) |
(188) |
42 403 |
(2 688) |
|
Income tax expense |
(17 036) |
– |
– |
(34) |
– |
(17 070) |
218 |
|
Profit after tax |
23 854 |
809 |
1 263 |
(405) |
(188) |
25 333 |
(2 470) |
|
Non-controlling interests |
(4 817) |
(9) |
25 |
(4 801) |
206 |
||
|
Attributable profit |
19 037 |
800 |
1 263 |
(405) |
(163) |
20 532 |
(2 264) |
|
EBITDA margin |
43.6% |
43.8% |
|||||
|
Effective tax rate |
41.7% |
40.3% |
|
Rm |
Impact of foreign exchange losses and gain6 |
IFRS 2 Charge due to Ghana localisation7 |
Disinvest- ments8 |
Deferred Tax Asset remea- surement9 |
Other non- operational items10 |
Adjusted 2022 (restated*) |
|
2022 |
||||||
|
Revenue |
– |
– |
– |
– |
– |
204 519 |
|
Other income |
– |
– |
– |
– |
– |
33 |
|
EBITDA |
– |
85 |
432 |
– |
274 |
90 671 |
|
Depreciation, amortisation and impairment of goodwill |
– |
– |
– |
– |
– |
(34 282) |
|
Profit from operations |
– |
85 |
432 |
– |
274 |
56 389 |
|
Net finance cost |
6 055 |
– |
– |
– |
– |
(12 018) |
|
Hyperinflationary monetary gain |
– |
– |
– |
– |
– |
- |
|
Share of results of associates and joint ventures after tax |
12 |
– |
– |
– |
– |
2 202 |
|
Profit before tax |
6 067 |
85 |
432 |
– |
274 |
46 573 |
|
Income tax expense |
(1 793) |
(4) |
– |
1 171 |
(17 478) |
|
|
Profit after tax |
4 274 |
81 |
432 |
1 171 |
274 |
29 095 |
|
Non-controlling interests |
(495) |
(13) |
– |
– |
(5 103) |
|
|
Attributable profit |
3 779 |
68 |
432 |
1 171 |
274 |
23 992 |
|
EBITDA margin |
44.3% |
|||||
|
Effective tax rate |
37.5% |
| 1 |
Represents the exclusion of the impact of goodwill, PPE, intangibles and associates impairments. 2023: PPE (R723 million) and intangibles (R3 million); 2022: goodwill (Mowali: R149 million, Bissau: R251 million , Botswana: R31 million and MEIH: R193 million), PPE (R173 million) and intangibles (R11 million). |
| 2 |
Represents the impairment loss on remeasurement of disposal group. 2023: Afghanistan (R900 million); 2022: Afghanistan (R1 263 million). |
| 3 | Represents net loss (after tax) on disposal of SA towers. (2023: R56 million; 2022: R405 million). |
| 4 |
Represents the net profit on disposal of PPE and intangibles. 2023: PPE (R38 million loss) and share of results from Iran (R10 million profit); 2022: PPE (R170 million profit), intangibles (R12 million loss) and share of results from Iran (R5 million profit). |
| 5 | The impact of hyperinflation is excluded for the operations that are currently accounted for on a hyperinflationary basis (MTN Irancell, MTN Sudan, MTN South Sudan and MTN Ghana), as well as those that have previously been accounted for on a hyperinflationary basis. The economy of Iran was assessed to be hyperinflationary effective 1 January 2020 and hyperinflation accounting has since been applied. The economy of Sudan was assessed to be hyperinflationary during 2018 and hyperinflation accounting has since been applied. The economy of South Sudan was assessed to be hyperinflationary effective 1 January 2016 and hyperinflation accounting has since been applied. The economy of Ghana was assessed to be hyperinflationary effective 1 January 2023 and hyperinflation accounting has since been applied. |
| 6 |
Adjustment for the net forex (gains)/losses impacting earnings for the respective periods. 2023: forex loss of R12 927 million; 2022: forex loss of R3 779 million. This includes the impact of forex in Iran. |
| 7 |
Represents IFRS 2 charge due to Ghana localisation (2023: R0 million; 2022: R68 million). |
| 8 |
Represents share of profits lost on disinvestments (sell-down) in Nigeria and Ghana (2023: R0 million; 2022: R432 million). |
| 9 | Represents deferred tax assets remeasurement on Mauritius’ prior year recognised tax expense (2023: R0 million; 2022: R1 171 million). |
| 10 | Represents other non-operational items relating to 2023: fintech separation costs and ATA matters of R405 million and 2022: fintech separation costs and ATA matters of R274 million. |
Rising inflation and interest rates, as well as a stronger US dollar, impacted operating costs and consumer discretionary spend in key markets.
The stronger average rand against most functional currencies had a negative translation impact on rand-reported service revenue. The Nigerian naira, in particular, depreciated significantly against the US dollar (US$) in 2023 following economic reforms by the new administration in June 2023, closing at N907.11 to the US$ in December 2023 from N461.10 in December 2022. The average rand weakened by 12.5% YoY and closed at R18.27 to the US$ from R17.05 in 2022, which impacted negatively on the balance sheet, especially owing to our US dollar-denominated debt.
Group total revenue increased by 13.0%* and service revenue increased by 13.5%*, supported by healthy growth across most of our larger operations: MTN SA (up 2.3%); MTN Nigeria (up 22.5%*); MTN Uganda (up 16.8%*); and MTN Ghana (up 35.0%*) MTN Sudan was a drag on topline growth, owing to the ongoing conflict in that country.
Group revenue in our connectivity business: voice grew by 3.3%* to R82.9 billion and data expanded by 23.0%* to R84.0 billion. Group revenue in our platforms: fintech grew by 21.8%* to R21.0 billion; digital was up by 10.0%* to R3.6 billion; enterprise grew by 23.4%* to R24.7 billion; and wholesale increased by 20.6%* to R8.7 billion.
Table 1: Group revenue by country
|
Actual (Rm) |
Prior (Rm) |
Reported % change |
Constant currency % change |
Contribution to revenue % |
|
|
South Africa |
51 807 |
50 640 |
2.3 |
2.3 |
23.4 |
|
Nigeria |
74 270 |
77 260 |
(3.9) |
22.5 |
33.6 |
|
SEA |
22 923 |
19 342 |
18.5 |
17.6 |
10.4 |
|
Uganda |
13 184 |
10 126 |
30.2 |
16.8 |
6.0 |
|
Zambia |
3 465 |
3 316 |
4.5 |
10.9 |
1.6 |
|
Other SEA |
6 274 |
5 900 |
6.3 |
23.6 |
2.8 |
|
WECA |
57 039 |
48 279 |
18.1 |
13.5 |
25.8 |
|
Ghana |
20 771 |
18 031 |
15.2 |
35.0 |
9.4 |
|
Cameroon |
9 905 |
7 727 |
28.2 |
11.0 |
4.5 |
|
Côte d'Ivoire |
10 302 |
8 918 |
15.5 |
(0.0) |
4.7 |
|
Other WECA |
16 061 |
13 603 |
18.1 |
2.6 |
7.3 |
|
MENA |
6 108 |
6 212 |
(1.7) |
(8.8) |
2.8 |
|
Sudan |
3 484 |
4 032 |
(13.6) |
(12.5) |
1.6 |
|
Afghanistan |
2 624 |
2 180 |
20.4 |
(3.3) |
1.2 |
|
Bayobab |
11 477 |
9 722 |
18.1 |
5.4 |
5.2 |
|
Head offices and eliminations |
(7 283) |
(6 936) |
(3.3) |
||
|
Total |
216 341 |
204 519 |
5.8 |
13.0 |
97.9 |
|
Hyperinflation |
4 715 |
2 484 |
2.1 |
||
|
Total reported |
221 056 |
207 003 |
6.8 |
13.0 |
100.0 |
Table 2: Group service revenue by country
|
Actual (Rm) |
Prior (Rm) |
Reported % change |
Constant currency % change |
Contribution to service revenue % |
|
|
South Africa |
41 882 |
40 848 |
2.5 |
2.5 |
19.9 |
|
Nigeria |
73 853 |
77 023 |
(4.1) |
22.1 |
35.1 |
|
SEA |
22 601 |
19 102 |
18.3 |
17.4 |
10.8 |
|
Uganda |
12 989 |
10 036 |
29.4 |
16.1 |
6.2 |
|
Zambia |
3 385 |
3 212 |
5.4 |
11.9 |
1.6 |
|
Other SEA |
6 227 |
5 854 |
6.4 |
23.8 |
3.0 |
|
WECA |
56 828 |
48 075 |
18.2 |
13.5 |
27.0 |
|
Ghana |
20 687 |
17 969 |
15.1 |
35.0 |
9.8 |
|
Cameroon |
9 864 |
7 699 |
28.1 |
10.9 |
4.7 |
|
Côte d'Ivoire |
10 264 |
8 872 |
15.7 |
0.1 |
4.9 |
|
Other WECA |
16 013 |
13 535 |
18.3 |
2.8 |
7.6 |
|
MENA |
6 089 |
6 185 |
(1.6) |
(8.7) |
2.9 |
|
Sudan |
3 475 |
4 013 |
(13.4) |
(12.3) |
1.7 |
|
Afghanistan |
2 614 |
2 172 |
20.3 |
(3.3) |
1.2 |
|
Bayobab |
11 471 |
9 722 |
18.0 |
5.4 |
5.5 |
|
Head offices and eliminations |
(7 283) |
(6 933) |
(3.5) |
||
|
Total |
205 441 |
194 022 |
5.9 |
13.5 |
97.8 |
|
Hyperinflation |
4 698 |
2 471 |
2.2 |
||
|
Total reported |
210 139 |
196 493 |
6.9 |
13.5 |
100.0 |
Table 3: Group revenue by segment
|
Actual (Rm) |
Prior (Rm) |
Reported % change |
Constant currency % change |
Contribution to revenue % |
|
|
Outgoing voice 1 |
68 646 |
72 629 |
(5.5) |
2.7 |
31.1 |
|
Incoming voice 2 |
12 355 |
12 220 |
1.1 |
6.5 |
5.6 |
|
Data 3 |
81 829 |
72 473 |
12.9 |
23.0 |
37.0 |
|
Digital 4 |
3 477 |
3 298 |
5.4 |
10.0 |
1.6 |
|
Fintech 5 |
20 584 |
17 269 |
19.2 |
21.8 |
9.3 |
|
SMS |
4 865 |
5 084 |
(4.3) |
6.4 |
2.2 |
|
Devices |
10 900 |
10 497 |
3.8 |
4.2 |
4.9 |
|
Wholesale 6 |
8 653 |
6 971 |
24.1 |
20.6 |
3.9 |
|
Other |
5 032 |
4 078 |
23.4 |
19.3 |
2.3 |
|
Total |
216 341 |
204 519 |
5.8 |
13.0 |
97.9 |
|
Hyperinflation |
4 715 |
2 484 |
2.1 |
||
|
Total reported |
221 056 |
207 003 |
6.8 |
13.0 |
100.0 |
|
1 Excludes international roaming and wholesale. 2 Includes local and international roaming and excludes wholesale. 3 Includes mobile and fixed access data and excludes roaming and wholesale. 4 Includes Rich Media services, content VAS, eCommerce and mobile advertising. 5 Includes Xtratime and mobile financial services. 6 Includes domestic wholesale, voice, SMS and data, leased lines and BTS rentals. |
|||||
|
Table 4: Group data revenue 1 |
||||
|
2023 Rm |
2022 Rm |
Reported % change |
Constant currency % change |
|
|
South Africa |
20 027 |
18 640 |
7.4 |
7.4 |
|
Nigeria |
31 690 |
29 405 |
7.8 |
38.6 |
|
SEA |
5 570 |
4 558 |
22.2 |
24.3 |
|
Uganda |
3 072 |
2 267 |
35.5 |
21.6 |
|
Zambia |
1 093 |
925 |
18.2 |
25.5 |
|
Other SEA |
1 405 |
1 366 |
2.9 |
29.6 |
|
WECA |
21 603 |
16 831 |
28.4 |
24.7 |
|
Ghana |
9 104 |
7 041 |
29.3 |
51.3 |
|
Cameroon |
3 816 |
2 750 |
38.8 |
20.1 |
|
Côte d'Ivoire |
3 341 |
2 624 |
27.3 |
10.1 |
|
Other WECA |
5 342 |
4 416 |
21.0 |
5.0 |
|
MENA |
2 688 |
2 791 |
(3.7) |
(9.6) |
|
Sudan |
1 530 |
1 923 |
(20.4) |
(19.2) |
|
Afghanistan |
1 158 |
868 |
33.4 |
7.2 |
|
Bayobab |
8 |
- |
100.0 |
100.0 |
|
Head offices and eliminations |
243 |
248 |
||
|
Total |
81 829 |
72 473 |
12.9 |
23.0 |
|
Hyperinflation |
2 158 |
1 206 |
||
|
Total reported |
83 987 |
73 679 |
14.0 |
23.0 |
|
1 Includes mobile and fixed access data and excludes roaming and wholesale. |
||||
Table 5: Group fintech revenue 2
|
Actual (Rm) |
Prior (Rm) |
Reported % change |
Constant currency % change |
|
|
South Africa |
1 214 |
1 058 |
14.7 |
14.7 |
|
Nigeria |
2 648 |
3 238 |
(18.2) |
3.7 |
|
SEA |
6 329 |
4 940 |
28.1 |
21.4 |
|
Uganda |
3 813 |
2 911 |
31.0 |
17.6 |
|
Zambia |
960 |
839 |
14.4 |
21.8 |
|
Other SEA |
1 556 |
1 190 |
30.8 |
31.5 |
|
WECA |
10 363 |
8 020 |
29.2 |
28.6 |
|
Ghana |
4 853 |
3 898 |
24.5 |
46.4 |
|
Cameroon |
1 772 |
1 223 |
44.9 |
25.4 |
|
Côte d’Ivoire |
940 |
807 |
16.5 |
0.8 |
|
Other WECA |
2 798 |
2 092 |
33.7 |
16.6 |
|
MENA |
48 |
35 |
37.1 |
17.1 |
|
Sudan |
8 |
6 |
33.3 |
60.0 |
|
Afghanistan |
40 |
29 |
37.9 |
11.1 |
|
Bayobab |
– |
– |
0.0 |
0.0 |
|
Head offices and eliminations |
(18) |
(22) |
||
|
Total |
20 584 |
17 269 |
19.2 |
21.8 |
|
Hyperinflation |
388 |
2 |
||
|
Total reported |
20 972 |
17 271 |
21.4 |
21.8 |
|
2 Includes Xtratime and mobile financial services. |
||||
Table 6: Group digital revenue 3
|
Actual (Rm) |
Prior (Rm) |
Reported % change |
Constant currency % change |
|
|
South Africa |
1 257 |
1 359 |
(7.5) |
(7.5) |
|
Nigeria |
1 091 |
849 |
28.5 |
65.6 |
|
SEA |
119 |
79 |
50.6 |
54.5 |
|
Uganda |
46 |
21 |
119.0 |
100.0 |
|
Zambia |
45 |
30 |
50.0 |
73.1 |
|
Other SEA |
28 |
28 |
0.0 |
0.0 |
|
WECA |
873 |
900 |
(3.0) |
(7.8) |
|
Ghana |
213 |
272 |
(21.7) |
(4.5) |
|
Cameroon |
257 |
199 |
29.1 |
11.7 |
|
Côte d’Ivoire |
319 |
309 |
3.2 |
(10.6) |
|
Other WECA |
84 |
120 |
(30.0) |
(38.7) |
|
MENA |
134 |
111 |
20.7 |
14.5 |
|
Sudan |
82 |
72 |
13.9 |
20.6 |
|
Afghanistan |
52 |
39 |
33.3 |
6.1 |
|
Bayobab |
– |
– |
0.0 |
0.0 |
|
Head offices and eliminations |
3 |
– |
||
|
Total |
3 477 |
3 298 |
5.4 |
10.0 |
|
Hyperinflation |
79 |
47 |
||
|
Total reported |
3 556 |
3 345 |
6.3 |
10.0 |
|
3 Includes rich media services, content VAS, eCommerce and mobile advertising. |
||||
Table 7: Cost analysis
|
Actual (Rm) |
Prior (Rm) |
Reported % change |
Constant currency % change |
% of revenue |
|
|
Handsets and other accessories |
12 169 |
11 956 |
1.8 |
3.2 |
5.5 |
|
Interconnect |
10 578 |
10 027 |
5.5 |
13.5 |
4.8 |
|
Roaming |
1 422 |
1 190 |
19.5 |
24.7 |
0.6 |
|
Commissions |
14 156 |
12 846 |
10.2 |
6.7 |
6.4 |
|
Government and regulatory costs |
8 287 |
7 277 |
13.9 |
13.7 |
3.7 |
|
VAS / Digital revenue share |
3 453 |
3 275 |
5.4 |
11.4 |
1.6 |
|
Service provider discounts |
4 728 |
4 562 |
3.6 |
22.6 |
2.1 |
|
Network and IS maintenance |
37 651 |
32 368 |
16.3 |
27.8 |
17.0 |
|
Marketing |
4 686 |
4 112 |
14.0 |
18.4 |
2.1 |
|
Staff costs |
14 812 |
12 589 |
17.7 |
16.3 |
6.7 |
|
Other opex |
14 839 |
14 386 |
3.2 |
6.0 |
6.7 |
|
Total |
126 781 |
114 588 |
10.6 |
15.3 |
57.4 |
|
IFRS 2 Charge from localisation in Ghana |
– |
85 |
0.0 |
||
|
Impairment loss on remeasurement of disposal group |
900 |
1 263 |
0.4 |
||
|
Impairment loss on Sudan warehouse due to ongoing conflict |
277 |
– |
0.1 |
||
|
Hyperinflation |
4 642 |
1 640 |
2.1 |
||
|
Total reported |
132 600 |
117 576 |
12.8 |
15.3 |
60.0 |
Total costs increased by 15.3%*, mainly as a result of higher network costs in MTN Nigeria because of forex and inflation impacts on BTS lease rentals and increased site rollout. Excluding the forex and inflation impacts on network costs, growth in total costs was approximately 11.4%*.
The key drivers of increased costs included higher interconnect and roaming, network-related and staff costs.
Overall cost increases were mitigated by our focus on expense efficiency. R2.6bn in total savings were realised in 2023, primarily from network, sales, distribution and admin expenses.
Table 8: Group EBITDA by country
|
Actual (Rm) |
Prior (Rm) |
Reported % change |
Constant currency % change |
|
|
South Africa |
18 623 |
19 480 |
(4.4) |
(4.4) |
|
Nigeria |
36 916 |
41 087 |
(10.2) |
14.2 |
|
SEA |
10 549 |
8 877 |
18.8 |
16.3 |
|
Uganda |
6 769 |
5 233 |
29.4 |
16.2 |
|
Zambia |
1 075 |
847 |
26.9 |
32.9 |
|
Other |
2 705 |
2 797 |
(3.3) |
11.1 |
|
WECA |
23 299 |
19 194 |
21.4 |
22.8 |
|
Ghana |
12 135 |
10 295 |
17.9 |
39.6 |
|
Cameroon |
3 749 |
2 752 |
36.2 |
17.9 |
|
Côte d’Ivoire |
3 392 |
2 950 |
15.0 |
(0.7) |
|
Other |
4 023 |
3 197 |
25.8 |
9.0 |
|
MENA |
1 800 |
2 716 |
(33.7) |
(35.6) |
|
Sudan |
1 065 |
2 128 |
(50.0) |
(48.8) |
|
Afghanistan |
735 |
588 |
25.0 |
3.1 |
|
Bayobab |
1 201 |
1 182 |
1.6 |
(10.7) |
|
Head offices and eliminations |
(2 580) |
(2 572) |
||
|
CODM EBITDA |
89 808 |
89 964 |
(0.2) |
9.8 |
|
Gain on disposal of SA towers |
76 |
371 |
||
|
IFRS 2 Charge from localisation in Ghana |
– |
(85) |
||
|
Impairment loss on remeasurement of disposal group |
(900) |
(1 263) |
||
|
Impairment loss on Sudan warehouse due to ongoing conflict |
(277) |
– |
||
|
Hyperinflation |
73 |
851 |
||
|
CODM EBITDA before impairment of goodwill and joint ventures |
88 780 |
89 838 |
(1.2) |
9.8 |
Group EBITDA decreased by 0.2% on a reported basis due to the impacts of elevated inflation and local currency devaluations (particularly the naira) placing pressure in operating costs. In constant currency terms, EBITDA increased by 9.8%*, before once-off items.
Table 9: Group depreciation and amortisation
|
Depreciation restated |
Amortisation |
|||||||
|
Actual (Rm) |
Prior (Rm) |
Reported % change |
Constant currency % change |
Actual (Rm) |
Prior (Rm) |
Reported % change |
Constant currency % change |
|
|
South Africa |
8 830 |
8 371 |
5.5 |
5.5 |
1 868 |
1 342 |
39.2 |
39.2 |
|
Nigeria |
10 415 |
10 839 † |
(3.9) |
22.7 |
2 376 |
2 075 |
14.5 |
47.7 |
|
SEA |
3 009 |
2 540 |
18.5 |
13.2 |
839 |
644 |
30.3 |
25.0 |
|
Uganda |
1 733 |
1 464 |
18.4 |
6.1 |
451 |
339 |
33.0 |
19.3 |
|
Zambia |
392 |
362 |
8.3 |
14.3 |
165 |
147 |
12.2 |
19.6 |
|
Other SEA |
884 |
714 |
23.8 |
29.4 |
223 |
158 |
41.1 |
43.9 |
|
WECA |
6 848 |
5 937 |
15.3 |
8.9 |
1 961 |
1 463 |
34.0 |
23.9 |
|
Ghana |
2 160 |
1 879 |
15.0 |
35.3 |
523 |
311 |
68.2 |
98.1 |
|
Cameroon |
1 131 |
984 |
14.9 |
(0.4) |
308 |
226 |
36.3 |
17.6 |
|
Côte d'Ivoire |
1 618 |
1 517 |
6.7 |
(7.8) |
524 |
381 |
37.5 |
19.4 |
|
Other WECA |
1 939 |
1 557 |
24.5 |
7.8 |
606 |
545 |
11.2 |
(1.9) |
|
MENA |
98 |
223 |
(56.1) |
(62.7) |
61 |
53 |
15.1 |
0.0 |
|
Sudan |
98 |
46 |
113.0 |
117.8 |
61 |
15 |
306.7 |
306.7 |
|
Afghanistan |
– |
177 |
(100.0) |
(100.0) |
– |
38 |
(100.0) |
(100.0) |
|
Bayobab |
489 |
510 |
(4.1) |
(12.7) |
69 |
30 |
130.0 |
109.1 |
|
Head offices, GlobalConnect and eliminations |
(10) |
(38) |
423 |
293 |
||||
|
Total |
29 679 |
28 382 † |
4.6 |
11.5 |
7 597 |
5 900 |
28.8 |
35.6 |
|
Hyperinflation |
4 451 |
233 |
541 |
102 |
||||
|
Total reported |
34 130 |
28 615 † |
19.3 |
11.5 |
8 138 |
6 002 |
35.6 |
35.6 |
† Nigeria's depreciation has been restated to be in line with restated Right of use asset which was incorrectly accounted for as per IFRS 16 in the prior year.
The Group depreciation charge increased by
11.5%* largely reflecting increased capex and the full-year depreciation impact of the tower sale and leaseback in South Africa.
Amortisation costs increased by
35.6%*
, driven mainly by spectrum acquisitions in the year.
Table 10: Net finance cost
|
Actual (Rm) |
Prior † (Rm) |
Reported % change |
Constant currency % change |
% of revenue |
|
|
Net interest paid/(received) |
15 302 |
12 066 |
26.8 |
40.2 |
6.9 |
|
Net forex losses/(gains) |
23 311 |
6 007 |
288.1 |
371.1 |
10.5 |
|
Total |
38 613 |
18 073 |
113.7 |
143.4 |
17.5 |
|
Hyperinflation |
456 |
253 |
0.2 |
||
|
Total reported |
39 069 |
18 326 |
113.2 |
143.4 |
17.7 |
|
† |
Nigeria’s net finance costs have been restated to correctly reflect the foreign exchange losses and finance lease costs which were incorrectly accounted for in the prior year. |
Net finance costs increased by 143.4%* to R39.1 billion. Higher finance costs were predominantly driven by higher net forex losses (up 371.1%* to R23.3 billion) due to an increase in net forex losses in Nigeria following significant naira devaluation in that country.
The average cost of borrowing was 12.2% (2022: 9.3%) due to an increase in interest rates.
We recorded a positive contribution o f R3.6 billion from associates and joint ventures, up 6.3% (35.8*) from December 2022. The contribution for FY 2023 was largely attributable to improved results from the Iran Internet Group (IIG).
Table 11: Taxation
|
Actual (Rm) |
Prior † (Rm) |
Reported % change |
Constant currency % change |
Contribution to taxation % |
|
|
Normal tax |
12 310 |
17 645 |
(30.2) |
(24.7) |
158.8 |
|
Deferred tax |
(6 226) |
(2 422) |
(157.1) |
(162.3) |
(80.3) |
|
Foreign income and withholding taxes |
1 214 |
1 595 |
(23.9) |
(27.7) |
15.7 |
|
Total |
7 298 |
16 818 |
(56.6) |
(53.4) |
94.2 |
|
Hyperinflation |
453 |
218 |
5.8 |
||
|
Total reported |
7 751 |
17 036 |
(54.5) |
(53.4) |
100.0 |
† Nigeria’s deferred tax has been restated to reflect the tax impact on the restated depreciation and net finance costs.
The reported Group effective tax rate (GETR) was 65.9%, compared to the prior year’s restated rate of 41.7%. While the Group had a lower PBT YoY, the significantly higher Sudan non-deductible expenses, hyperinflationary adjustments, increased WHT due to the lower PBT as well as unrecognised deferred tax assets contributed to the higher GETR.
For the period ended December 2023, the Group’s reported taxation charge decreased by 54.5% YoY mainly due to lower Group PBT. The normalised GETR, which is adjusted for the significant once-off items such as the hyperinflationary adjustment and the impairment of the Afghanistan assets was 39.5%. This is in line with our medium-term guidance range (mid-to-high 30%s). It was slightly lower in the prior year (December 2022: 37.1%) mainly due to a higher reported PBT.
Cash inflows generated from operations decreased by 6.0% to R64.1 billion, with key cash outflows including tax paid of R15.8 billion, net interest paid of R13.5 billion and cash capex of R39.4 billion (excluding spectrum and licences). OpFCF decreased by 6.1%, impacted by lower earnings and higher capex spend. Excluding the acquisition of spectrum and licences, underlying OpFCF was down 6.4%.
Table 12: Capital expenditure
|
Actual (IFRS 16) (Rm) |
Actual (ex-leases) (Rm) |
Prior (ex-leases) (Rm) |
Reported % change |
Constant currency % change |
|
|
South Africa |
15 709 |
10 101 |
8 816 |
14.6 |
14.6 |
|
Nigeria |
16 785 |
12 652 |
13 673 |
(7.5) |
13.2 |
|
SEA |
6 054 |
4 421 |
3 260 |
35.6 |
36.8 |
|
Uganda |
3 478 |
2 366 |
1 453 |
62.8 |
44.4 |
|
Zambia |
757 |
642 |
636 |
0.9 |
21.1 |
|
Other SEA |
1 819 |
1 413 |
1 171 |
20.7 |
32.9 |
|
WECA |
21 095 |
10 314 |
8 063 |
27.9 |
21.6 |
|
Ghana |
5 521 |
4 303 |
3 208 |
34.1 |
48.8 |
|
Cameroon |
5 992 |
1 700 |
1 072 |
58.6 |
36.8 |
|
Côte d'Ivoire |
6 828 |
1 686 |
1 722 |
(2.1) |
(15.0) |
|
Other WECA |
2 754 |
2 625 |
2 061 |
27.4 |
11.1 |
|
MENA |
1 030 |
896 |
1 425 |
(37.1) |
(37.9) |
|
Sudan |
619 |
619 |
1 264 |
(51.0) |
(50.4) |
|
Afghanistan |
411 |
277 |
161 |
72.0 |
42.5 |
|
Bayobab |
1 501 |
1 501 |
1 311 |
14.5 |
4.1 |
|
Head offices and eliminations |
257 |
256 |
835 |
||
|
Total |
62 431 |
40 141 |
37 383 |
7.4 |
12.9 |
|
Hyperinflation |
1 191 |
1 001 |
857 |
||
|
Total reported |
63 622 |
41 142 |
38 240 |
7.6 |
12.9 |
Table 13: Net debt analysis
|
Rm |
Cash and cash equivalents* |
Interest- bearing liabilities |
Inter- company eliminations |
Net interest- bearing liabilities |
Net debt/ (cash) December 2023 |
Net debt/ (cash) December 2022 |
|
|
South Africa |
995 |
27 210 |
(27 210) |
– |
(995) |
(2 270) |
|
|
Nigeria |
15 040 |
23 709 |
– |
23 709 |
8 669 |
4 624 |
|
|
SEA |
2 701 |
4 109 |
(625) |
3 484 |
783 |
1 943 |
|
|
Uganda |
1 212 |
978 |
– |
978 |
(234) |
224 |
|
|
Zambia |
178 |
2 020 |
(598) |
1 422 |
1 244 |
1 487 |
|
|
Other SEA |
1 311 |
1 111 |
(27) |
1 084 |
(227) |
232 |
|
|
WECA |
11 356 |
13 911 |
(5 027) |
8 884 |
(2 472) |
(425) |
|
|
Ghana |
4 901 |
352 |
– |
352 |
(4 549) |
(2 232) |
|
|
Cameroon |
3 198 |
2 692 |
– |
2 692 |
(506) |
(927) |
|
|
Côte d’Ivoire |
1 005 |
3 666 |
– |
3 666 |
2 661 |
2 001 |
|
|
Other WECA |
2 252 |
7 201 |
(5 027) |
2 174 |
(78) |
733 |
|
|
MENA |
936 |
4 800 |
(4 800) |
– |
(936) |
(881) |
|
|
Sudan |
936 |
4 800 |
(4 800) |
– |
(936) |
(881) |
|
|
Afghanistan |
– |
– |
– |
– |
– |
– |
|
|
Bayobab |
2 155 |
106 |
2 |
108 |
(2 047) |
(1 986) |
|
|
Head offices and eliminations |
16 938 |
48 855 |
(1) |
48 854 |
31 916 |
23 139 |
|
|
Total reported |
50 121 |
122 700 |
(37 661) |
85 039 |
34 918 |
24 144 |
|
|
Iran |
614 |
1 480 |
– |
1 480 |
866 |
(201) |
* Includes restricted cash, current investments and excludes cash held for sale in Afghanistan, Conakry and Bissau.
Group net debt increased to R34.9 billion from R24.1 billion, in December 2022, driven mainly by an increase in debt at Holdco level and MTN Nigeria and lower cash balances.
As of 31 December 2023, the Group's net-debt-to-EBITDA ratio of 0.4x (31 December 2022: 0.3x) was comfortably within our targeted loan covenant level. Our net interest cover of 6.4x was also within covenant thresholds. Our Group cash and cash equivalents balance at the end of December 2023 was R50.1 billion.
Holdco borrowings increased to R48.9 billion, from R45.8 billion in December 2022, mostly due to forex impacts on the Eurobonds and new borrowings. We remain focused on optimising the mix of our Holdco debt with the mix of MTN’s debt, at December 2023, at 23% non-ZAR and 77% ZAR (December 2022: 36% and 64%, respectively).
At the end of December 2023, our Holdco leverage increased to 1.4x, impacted by rand depreciation against the US$ and our election of scrip dividend options in MTN Nigeria and MTN Ghana.

