

Encouraging underlying operational momentum
"The momentum of our business was reflected in the continued growth of our ecosystem, with data traffic and fintech volumes up by 35.7% (36.7% excluding JVs) and 18.0%, respectively. In H1, we deployed R13.4 billion of capex, reflecting a capex intensity of 14.8%, largely reflecting lower spend by MTN Nigeria, as the Opco focused on reducing its exposure to US dollar denominated obligations. In the period, we rolled out 1 556 4G and 829 5G sites. Our focus on network quality and competitiveness has underpinned the NPS position in our consolidated markets."


“MTN delivered a solid underlying performance in H1 2024, with pleasing progress in some key markets. This result, achieved against a challenging macro backdrop, was underpinned by the continued execution of our commercial initiatives and Ambition 2025 strategy.”
Ralph Mupita
Group President and CEO
|
Rm |
H1 24 |
H1 23 |
% change Reported |
% change Constant currency |
|
Group service revenue |
85 323 |
107 735 |
(20.8) |
12.1 |
|
– South Africa |
21 110 |
20 431 |
3.3 |
3.3 |
|
– Nigeria |
20 523 |
43 583 |
(52.9) |
32.4 |
|
Group EBITDA˜ (before once-off items) |
29 046 |
49 407 |
(41.2) |
(0.4) |
|
– South Africa# |
9 566 |
9 173 |
4.3 |
4.3 |
|
– Nigeria^ |
7 377 |
23 260 |
(68.3) |
(10.8) |
|
Group EBITDA margin |
32.0% |
43.6% |
(11.6pp) |
(4.4pp) |
|
– South Africa# |
36.5% |
36.1% |
0.4pp |
0.4pp |
|
– Nigeria^ |
35.7% |
53.1% |
(17.4pp) |
(17.4pp) |
|
Capital expenditure (capex, IFRS 16) |
19 220 |
33 764 |
||
|
– Capex (ex-leases) |
13 433 |
17 232 |
||
|
– Capex intensity (ex-leases) |
14.8% |
15.2% |
||
~ Earnings before interest, tax, depreciation and amortisation.
^ MTN Nigeria performance impacted by material naira devaluation against the US$.
# Excludes once-offs, including gains and losses on disposals. Includes exceptional sale of insurance receivable.
Unless otherwise stated, financial and non-financial growth rates are presented on a constant currency basis and are year-on-year (YoY, 6M to June 2024 versus 6M to June 2023).
Service revenue excludes device and SIM card revenue. Data revenue is mobile and fixed access data and excludes roaming and wholesale. Fintech includes MoMo, insurance, airtime lending and e-commerce. Active data users are a count of all subscribers at a point in time who had a revenue-generating event in the specified period (90 days) prior to that point in time and during the past 30 days had data usage greater than or equal to 5 megabytes. MoMo users are 30-day active users.
Non-financial numbers included in these interim results are reported excluding Afghanistan in the base year following the Group’s exit in February 2024. MTN Afghanistan results have been disclosed up to February for 2024. As a result, the 2023 comparatives include the results for the two months ending February 2023.
Focus on execution as we navigate the macro headwinds impacting our business
Although the underlying commercial momentum and strategy execution were solid in the period, macro headwinds impacted operating results. The further devaluation in the naira against the US dollar, the translation impact on reporting currency (rands) of the naira and the ongoing conflict in Sudan had the most significant impact on reported results.
Notwithstanding, we are encouraged by the strong operational performance in other key markets in H1. MTN South Africa (MTN SA), which completed its network resilience plan in the period, demonstrated encouraging progress in key areas of the business. This helped to drive some acceleration in overall service revenue.
MTN Nigeria delivered a strong reported underlying performance, despite the severe macro impacts on its financial performance. The Opco made good progress in key initiatives in the period, including acceleration of its topline, optimisation of capex and reduction of its US dollar denominated obligations.
MTN Ghana and MTN Uganda reported strong results, while the broader Southern and East Africa (SEA region) delivered a solid overall performance, with service revenue growth ahead of blended regional inflation. Within the West and Central Africa (WECA) portfolio, MTN Cameroon contributed positively as well with topline growth exceeding local inflation.
The fintech business grew its topline in line with medium-term guidance, with solid continued ecosystem development and strong growth in advanced services.
We have also made pleasing progress on some key strategic priorities, particularly localisation initiatives and optimisation of our portfolio.
Solid H1 2024 results achieved in challenging operating environment
In the above context, our subscriber base ended the period at 288 million with headwinds from subscriber registration regulations in markets such as Ghana and Nigeria, the decline in subscribers in Sudan amid the ongoing conflict and our exit from Afghanistan. In terms of momentum, the underlying growth in our customer base excluding Sudan and Afghanistan was 3.2% YoY (3.1 million net additions in the period). Active data subscribers were up 9.2% to 150.2 million (up 10.0% excluding JVs), while MoMo MAU (excluding OTC customers) rose by 10.6% to 62.6 million.
The Group delivered solid service revenue growth of 12.1%*, with pleasing expansion in data (up 21.0%*) and fintech (up 27.2%*) revenues. Within fintech, advanced services continued to grow strongly and reported an increase of 58.2%*. The EBITDA margin of our fintech business was achieved within our target range of mid to high-30%.
EBITDA softened marginally by 0.4%*, reflecting an EBITDA margin of 36.5%* (H1 2023: 40.9%*), which was impacted by the overall headwinds to topline and upward cost pressures from macro factors headwinds. We partially mitigated these with the execution of our expense efficiency programme, with savings of R2.4 billion realised in the period. Adjusting for MTN Sudan, service revenue would have grown by 13.6%* (H1 2023: 14.7%*), with an EBITDA margin of 36.9%* (H1 2023: 40.9%*).
Resilient balance sheet and liquidity positions
The Group net-debt-to-EBITDA of 0.8x, as at 30 June 2024 (December 2023: 0.4x), remained within our loan covenant limit of 2.5x. In the period, we paid down debt of approximately R16.3 billion, including R8.4 billion by MTN Nigeria.
Our holding company (Holdco) leverage ratio ended the period at 1.6x (December 2023: 1.4x). This included some unfavourable effects from foreign exchange movements, however, our Holdco leverage position was supported by R6.5 billion in cash upstreamed from operations in H1. Over and above this, we repatriated R1.7 billion of localisation gross proceeds from MTN Ghana (R0.7 billion) and MTN Uganda (R1.0 billion) in the period.
We successfully refinanced R1.5 billion in 2024 maturities and raised an additional R1 billion to strengthen liquidity at the Holdco. We maintained a positive liquidity position, with headroom of R30.4 billion as at 30 June 2024.
Our Holdco debt currency mix ratio (US$:ZAR) improved to 22:78 (31 December 2023: 23:77), well within our medium-term objective of maintaining foreign currency denominated debt to below 40%.
Renegotiation of IHS leases in Nigeria
On 7 August 2024, we announced the successful renegotiation with IHS to amend the binding commercial terms of the existing infrastructure sharing and master lease agreements in Nigeria. The revised terms meaningfully reduce the US dollar indexed component of the leases linked to a discounted US consumer price index (CPI), and remove technology-based pricing, allowing payments for new upgrades based on tower space and power. The renegotiated agreements incorporate an energy cost component indexed to the cost of providing diesel power; however, the terms also provide for some discounts and incentives over the life of the contracts.
Based on current assumptions for 2024 we anticipate that the renegotiated terms will result in a benefit to MTN Nigeria’s EBITDA margin of between 3-4pp for FY 2024; on an annualised basis, this approximates to 4-5pp. In terms of cash flow effects, we estimate that the new terms will result in a benefit of between NGN75-85 billion. On an annualised basis, this approximates to NGN100-110 billion.
Ambition 2025 execution
We are pleased to have concluded a number of strategic initiatives in the period, including the signing of definitive agreements with Mastercard for a minority investment and the sale of MTN Afghanistan in February 2024. The latter completed our exit from consolidated Middle East operations.
In terms of localisation priorities, we achieved the 25.0% localisation requirement in MTN Ghana for its 4G licence, with local ownership now at 27.9% by the end of H1. Also in H1, we announced successfully executed the further sell-down of 7% of MTN Uganda, achieving compliance with local listings requirements of a minimum public float of 20%. On 7 August 2024, we announced the sale of MTN Guinea-Bissau as part of our portfolio optimisation programme.
These developments underscore the pleasing progress in our execution of Ambition 2025 priorities amid headwinds in our operating, regulatory and capital markets environments.
Outlook, priorities and medium-term guidance
Notwithstanding the prevailing macroeconomic and geopolitical conditions affecting our trading environment and business, we remain resolute in executing on our commercial and strategic priorities. We are working to accelerate expense efficiencies to help manage the prevailing macro headwinds, in terms of which we continue to target R7-8 billion in cost savings over the next three years.
The completion of its network resilience plan during H1 provides a strong foundation for MTN SA to support growth against the macroeconomic headwinds, which continue to place pressure on consumer spend. This is also driving the ongoing evolution in customer behaviour to optimise consumption of bundles. Notwithstanding, we will continue the work to accelerate topline and deliver a healthy EBITDA, PAT and cash flow profile.
MTN Nigeria will press ahead with the initiatives outlined to restore its profitability and balance sheet profile, particularly in resolving its negative equity position. Tariff increases remain critical to the recovery and sustainability of the industry in Nigeria and sector engagements with the relevant authorities are ongoing.
In our Markets portfolio, the priority is to sustain the strong growth in markets like Ghana, Uganda and Cameroon; while implementing the necessary initiatives to turn around the performances in Côte d’Ivoire Rwanda and Zambia.
In our platform businesses, we will leverage partnerships to accelerate growth and commercial monetisation. In fintech, we are scaling the business through sequential launches of commercial initiatives with Mastercard across various markets in the remainder of the year, with a focus on maintaining the strong momentum in advanced services growth.
We are making good progress in the commercial roll-out of our card issuance and acceptance in line with our partnership with Mastercard. We are prioritising seven markets in our card issuance roadmap and four markets for card acceptance during 2024.
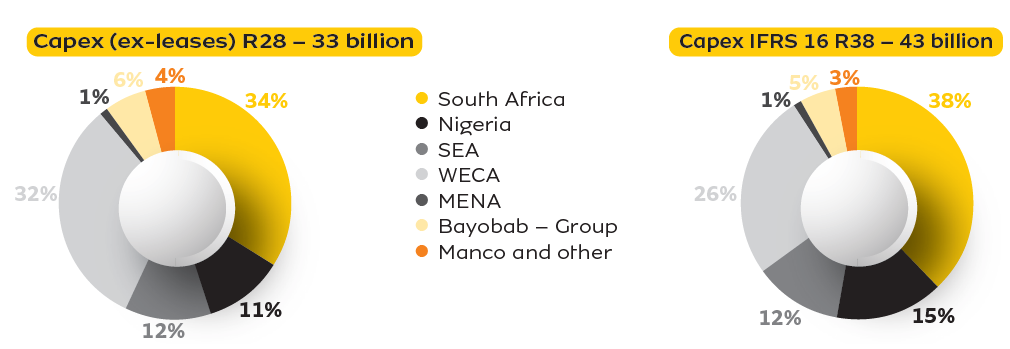
We maintain our overall medium-term guidance framework, with capex for FY 2024 anticipated to be in the R28-33 billion range. We will continue on the execution of our Ambition 2025 strategy to drive growth and unlock value for all our stakeholders over the medium term. The Board anticipates paying a minimum ordinary final dividend of 330 cents per share for FY 2024.”

Operating context
In H1, blended inflation across our footprint averaged 14.1% (H1 2023: 17.8%), ticking up slightly in Q2 by 0.5pp). In terms of our larger markets: trends in South Africa, Ghana and Uganda moderated in the first half with average inflation rates of 5.3%, 23.9% and 3.4% respectively (H1 2023: 6.8%, 46.2% and 8.0%). H1 inflation in Nigeria ticked up to an average of 32.8% (H1 2023: 22.1%), exacerbated by local currency weakness.
Local currencies remained volatile in H1, with constrained availability of foreign exchange in some markets. In particular, the further weakening of the naira against the US dollar had a major impact on the MTN Nigeria and Group financial performances, especially costs. The naira averaged N1 393/US$ in H1 (H1 2023: N481/US$) and closed the period with a rate of N1 505/US$ as at 30 June 2024 (31 December 2023: N907/US$). Furthermore, the weakness of the naira and some of the other local currencies in our portfolio against the rand also negatively affected our reported results on translation.
We maintained our focus on implementing SIM registration regulations in some markets, which impacted our overall subscriber evolution in the short term. Importantly, engagements and initiatives regarding tariff increases remained a priority in H1. Notably, MTN SA and MTN Ghana implemented pricing initiatives in some product lines in the period to mitigate against macro headwinds. MTN Nigeria continues to engage authorities in Nigeria, through the telecom industry body; this remains an ongoing process hampered by the intensification of macro pressures on consumers.
The ongoing conflict in Sudan reduced our ability to operate in the country, with fuel shortages, power outages and disruptions to network availability. However, due to network topology, MTN Sudan was able to recover the network availability at the end of May 2024. MTN maintained its efforts to ensure the safety of our people as well as infrastructure as far as possible. We offer our sincere sympathies to everyone affected by the conflict in the country.
The business also felt the effects of the well-documented cable cuts – especially in Q1 – which resulted in downtime for significant subsea cables connecting the African continent. Several key subsea cables, including ACE, SAT-3, WACS and MainOne, were affected simultaneously, leading to widespread disruption. While other parts of Africa experienced some disruptions due to other cable outages, the concentrated impact on West Africa made it the epicentre of the crisis. This led to negative effects on revenue performance in some of our markets – particularly in WECA – as well as Bayobab.
Resilient underlying performance with continued momentum in data
Against a challenging macro backdrop, MTN delivered a solid underlying set of results in the six months ended 30 June 2024. Group service revenue declined by 20.8% (up 12.1%* on constant currency) to R85.3 billion (H1 2023: R107.7 billion), with growth of 3.3% in MTN SA, 32.4%* in MTN Nigeria, 31.3%* in MTN Ghana and 20.4%* in MTN Uganda. Excluding MTN Sudan, service revenue would have been up by 13.6%*.
Voice revenue was 0.4%* lower with voice traffic down by 8.9% YoY (11.9% excluding JVs). Performance in MTN SA remained under pressure as customers are substituting voice usage with over-the-top (OTT) platforms. There was also a drag from MTN Ghana, as customers migrated to lower value packages. The performance of voice in other markets remained resilient, largely underpinned by pricing initiatives and base growth initiatives. Excluding MTN SA – the more mature voice market within our portfolio – and MTN Sudan, overall voice revenue increased by 2.6%*.
Data revenue revenue rose by 21.0%*. The overall performance was attributable to growth in active data subscribers which grew 9.2% YoY (10.0% excluding JVs), coupled with double-digit usage growth of 24.3% YoY to 10.4GB per user per month (24.3% to 7.5GB excluding JVs) and pricing optimisation. Data traffic rose by 35.7% (up 36.7% excluding JVs) during H1, underpinned by our continued investment in network quality and capacity. Excluding MTN Sudan, data revenue would have been up by 23.3%*.
The population covered by our 3G and 4G networks grew by 1.0 million and 4.8 million respectively. We recorded 185 million smartphones on our network, representing 64.5% penetration of our customer base (H1 2023: 59.8%) and reduced the average effective rate per megabyte of data by 40.0% YoY.
Building the largest and most valuable fintech platform
Fintech revenue increased by 27.2%* YoY, in line with our medium-term guidance, with strong performances in Ghana, Uganda and Cameroon. We sustained the strong growth in advanced services revenue (up 58.2%*) relative to basic services (up 20.6%*), in line with our strategy. The contribution of advanced services to total fintech revenue rose to 24.9% in H1 (up 4.9pp). This performance underpinned an EBITDA margin for the business in the mid to high-30% range, which is in line with our target.
MoMo active users increased by 9.1% to 66.0 million; excluding OTC customers in Nigeria, MAU increased by 10.6% YoY to 62.6 million, largely driven by Ghana, Uganda and Rwanda. The growth in aur active agent network was relatively moderate (2.4% to 1.3 million), as our distribution initiatives focused on the recruitment of more sustainable agents. Active merchants grew by 49.8% to 2.3 million.
The overall development of our fintech ecosystem continued to exhibit strength and resilience with a 18.0% increase in transaction volumes to 9.7 billion transactions, and transaction value up by 19.1%* to US$146.6 billion.
Key fintech verticals
Our payments and e-commerce ecosystem continued to expand strongly, supported by the growth in merchants and unique payer’s activity. The total value of MoMo merchant payments rose by 31.1%* YoY to US$9.0 billion.
In BankTech, we facilitated a total loan disbursement value of US$731.6 million^ (up 72.0%*). This outcome was underpinned by robust growth in loan disbursements and unique users utilising the service; particularly in Ghana, Uganda and Rwanda. We are pleased with the evolution of our partner-led lending products in more established operations and the contribution from the newly introduced markets, which underpinned the performance.
The total value of remittances grew strongly by 42.4%* YoY to US$1.9 billion in H1. This was driven by growth in enhanced customer experience, operational optimisation to reinforce real time service availability and investment in digital marketing activities. We also activated services in new markets, including eSwatini, South Africa and South Sudan. The number of outbound corridors expanded to 174 and inbound to 577.
Our InsurTech platform aYo’s performance, within our strategic alliance, was driven by our higher-average-revenue-per-policy focus, positive performance of the MTN SA device insurance book, and stronger focus on high-priority markets.
Bayobab
The first half of the year presented significant headwinds including the conflict in Sudan, local currency volatility and the cable cuts that resulted in downtime for eight significant subsea cables connecting the African continent. The impacts from these cuts included major simultaneous outages on the west coast of Africa of four main cables, which we successfully restored within a few days. This was achieved using existing redundant capacity links, as well as the newly installed Equiano cable.
In this context, Bayobab delivered a resilient financial performance with consolidated external revenue increasing by 4.9%* to R3.4 billion. The conflict in Sudan and the depreciation of the naira (which influenced pricing and traffic) negatively affected the Communication Platforms’ external revenue, which increased by 5.0%* YoY. The Fibre segment’s external revenue was 4.6%* higher, with cable cuts impacting the conclusion and implementation of certain contracts.
In H1, Bayobab secured new fixed connectivity infrastructure deals amounting to US$9.4 million.
Growing our other platforms
Digital revenue increased by 19.3%* YoY to R1.6 billion, underpinned by expansion into new business segments. The adoption of digital products continued to expand, supported by revamped offers, particularly in Nigeria and Ghana. We maintained our focus on scaling the Gaming and Video verticals, which delivered pleasing revenue growth in the period.
In H1, our super app platform ayoba grew its user base by 28.6% YoY to 36 million MAU, with higher adoption and retention rates achieved as a result of enhanced communication features. We have established a 11.6 million MAU base in countries where MTN does not offer GSM service, illustrating the super app platform's potential to expand as an OTT offering across the African continent.
The focus of ayoba was on launching new B2B services to foster greater ayoba awareness, with strategic introductions to key advertising industry partners paving the way to increased sales and continuing to ramp up commercial monetisation. Key advertising products were launched in South Africa and Ghana, with Nigeria and Cameroon to follow in August. We also grew the partner ecosystem with over 80 new partners launching in the first half of the year.
Enterprise service revenue increased by 25.9%* YoY, supported by double-digit growth in three of our top six markets and enabled by the Group’s strategic platform transformation, focusing on ICT solutions. MTN SA, which delivered growth of 15.0% (boosted by some once-off revenues in ICT), benefited from strong data product propositions as well as distribution channel expansion in the digital mobile advertising and core mobile businesses. Enterprise revenue for MTN Nigeria grew by 64.3%*, led by a significant increase in the adoption of mobile and fixed connectivity services.
Our enterprise business has achieved remarkable progress driven by our Core Mobile Portfolio, Fixed Connectivity services, ICT and Converged Solutions. We made significant strides in expanding our offerings in Microsoft, Cloud, IoT, and Unified Communications. These achievements underscore our commitment to innovation and excellence, positioning MTN Enterprise as a leader in the industry.
Wholesale revenue increased by 6.9%*, with MTN SA’s wholesale revenue decreasing by 0.1% (including incoming voice). Excluding incoming voice, MTN SA’s wholesale revenue increased by 2.5% off the strong base of H1 2023.

The Group’s EBITDA margin in constant currency terms, which also excludes the effects of once-off items, narrowed by 4.4pp* to 36.5%* (down 0.4pp* to 36.9%*, excluding MTN Sudan), reflecting of the pressures on the topline as well as the impacts of increased inflation and naira devaluation on operating expenses.
The Group’s reported EBITDA margin before once-off items was 32.0% compared to 43.6% in June 2023. This outcome excluded a number of non-operational items totalling a net -R883 million. This comprises a gain on the sale of SA towers of R11 million, gain on disposal of Afghanistan of R1 018 million, offset by the impairment of Afghanistan assets of R146 million.
The H1 2023 margin excluded a number of non-operational items totalling a net -R539 million. This comprised a gain on sale of SA towers of R53 million, impairment of Afghanistan fixed assets of R385 million and million and the impairment of Sudan fixed assets of R207 million.

Our Stock Exchange News Service (SENS) announcement for financial results for the year ended 31 December 2023, dated 25 March 2024, detailed the restatements to our H1 2023 results. In this context basic earnings per share (EPS) decreased to a 409 cents loss per share (restated H1 2023: 229 cents).
H1 2024 EPS includes impairment losses of -203 cents that mainly relate to property, plant and equipment; impairment loss on remeasurement of disposal groups of -8 cents; gain on disposal of subsidiary of 56 cents and the net profit on disposal of property, plant and equipment and intangible assets of 2 cents.
Adjusting for the above factors, totalling a net of -153 cents, reported headline earnings per share (HEPS) decreased to a loss of 256 cents (restated H1 2023: 260 cents).
HEPS was negatively impacted by some non-operational and once-off items of approximately -629 cents (restated H1 2023: -493 cents) for the six-month period. These include: hyperinflation adjustments of -57 cents (H1 2023: -38 cents); foreign exchange losses of -519 cents (restated H1 2023: -455 cents), which includes naira depreciation impact of -389 cents (restated H1 2023: -409 cents); deferred tax charge/asset reversal of -28 cents (H1 2023: nil); and other non-operational items of -25 cents (H1 2023: nil).
Adjusted HEPS decreased by 50.5% to 373 cents (restated H1 2023: 753 cents), impacted by the previously-noted effects of naira devaluation, translation to reporting currency and conflict in Sudan.

The effects of naira devaluation reduced AHEPS by total of -90 cents (H1 2023: -4 cents); the translation impacts of key markets MTN Nigeria, MTN Ghana and MTN South Sudan by a combined -310 cents and the performance of MTN Sudan by -16 cents (H1 2023: 19 cents profit). Excluding these effects, underlying AHEPS would have been 789 cents (up 6.9%).
We continued to invest in the capacity of our networks, investing capex of R19.2 billion on an IFRS 16 reported basis, which is 43.1% lower YoY. Capex (ex-leases) declined by 22.0% to R13.4 billion, largely reflecting lower deployment in Nigeria, and includes a hyperinflation impact of -R45 million (H1 2023: R51 million).
In the period, we rolled out 1 053 3G and 1 556 4G sites with capex intensity decreasing by 8.6pp to 21.2% on a reported basis (down 0.4pp to 14.8%, ex‑leases), as we sustained our investments in the capacity and resilience of our networks.
Group operating free cash flow (OpFCF) was 51.8% lower to R9.1 billion, including the impacts of spectrum and licence acquisitions. Adjusting for payments made for spectrum acquisitions and licence renewals, OpFCF would have been R9.9 billion.
ROE (adjusted for non-operational items, including hyperinflation) declined by 4.2pp to 20.2%, from 24.4% in December 2023 (H1 2023: 24.4%). This is a reflection of the impact of macroeconomic headwinds, particularly the Naira devaluation, on our financial performance.
We are pleased with the progress in our key strategic priorities, particularly given the challenges in our operating and capital markets. Following the conclusion of the minority equity investment by Mastercard into our Group Fintech business and exit of MTN Afghanistan in February 2024, we made further strides in our localisation and portfolio optimisation programmes.
By the end of Q2 2024, MTN Ghana achieved the 25.0% localisation requirement for its 4G licence, with local ownership now at 27.9%. In June 2024, we successfully completed the further sell-down of a further 7% in MTN Uganda. This was undertaken in compliance with regulatory licence conditions in Uganda and, importantly, in accordance with our objective to broaden the local shareholding in MTN Uganda. The offer was 2.3 times oversubscribed and MTN Uganda has now attained the 20% minimum public float required by the Uganda Securities Exchange Listing Rules 2021 as well as the regulations issued by the Uganda Communications Commission. We realised gross proceeds of R1.7 billion from these localisations.
In terms of our broader endeavours to streamline and optimise the portfolio, on 7 August 2024, we announced the completion of the sale of MTN Guinea-Bissau to Telecel Group Mobile.
These initiatives support our priorities to reduce risk within our business and create shared value for our stakeholders in the markets we serve. We remain committed to the ongoing execution of our ARP and portfolio transformation programmes, with efforts in MTN Nigeria and MTN Cameroon still underway, subject to conducive market conditions.
In line with our policy, there is no interim dividend being declared for H1 2024 (H1 2023: nil). The Board of Directors (Board) anticipates paying a minimum ordinary final dividend of 330cps for FY 2024.

Listed Opcos’ published H1 2024 results
The published H1 results of our listed Opcos can be viewed at:
MTN SA continued to navigate the challenging operating environment in South Africa, benefiting from a slight easing of forex volatility and consumer price inflation. Nevertheless, inflation for the period ended at 5.1%, remaining towards the upper end of the South African Reserve Bank’s (SARB) target range. Despite the macro headwinds, MTN SA delivered a resilient performance in the first half of 2024, with encouraging momentum in the second quarter. Service revenue growth accelerated to 3.6% in Q2 2024, from 3.0% in Q1.
MTN SA successfully completed its network resilience initiatives in Q1 2024. This strategic investment positioned the business to provide an average network availability of over 95%, under stage 6 loadshedding. The improved network availability in H1 as supported an improvement in customer satisfaction, as evidenced by the uplift in MTN SA’s net promoter score (NPS) to the leading position in South Africa since March 2024.
Solid operational result with improved Q2 momentum
On the back of investment and commercial interventions, the business delivered solid service revenue growth of 3.3% in H1 (up 3.6% YoY in Q2).
The result was underpinned by a 4.7% increase in the number of subscribers to 38.5 million, a net addition of 1.0 million in the period. Postpaid subscribers grew by 9.2% to 9.4 million, driven by stronger uptake of integrated voice and data plans as well as home propositions.
Prepaid customers increased by 3.3% to 29.0 million in H1. MTN SA made further progress in driving its CVM strategy, with the contribution of CVM-driven bundles to service revenue rising by 8.3pp YoY to 32.6% in H1 2024.
Outgoing voice revenue was 5.5% lower in H1, reflecting a continued improvement in trend during the period. This outcome was supported by the significant improvement in network availability driven by the investments made in resilience.
Total data revenue grew by 2.4% in H1, contributing 47.6% of MTN SA’s total service revenue. This was driven by a 10.5% increase in active data subscribers, reaching 21.6 million, with a 36.5% rise in data traffic in H1.
Traffic growth was boosted by increased data consumption per active postpaid data subscriber, which amounted to approximately 21.9GB per month (up 51.0% YTD); with the bulk of this advancement attributable to fixed wireless access (FWA). An active prepaid data subscriber’s consumption increased to around 3.1GB (up 9.9% YTD).
The consumer postpaid business saw a 3.2% increase in service revenue in H1 – with an uptick in momentum in Q2 – driven by higher subscriber numbers, continued strong data usage and price adjustments effected in February 2024. The overall performance was tempered by reduced out-of-bundle spend as customers continued to optimize their spending, given the ongoing economic pressures.
Furthermore, MTN SA revitalised FTTH, FWA Home Internet and Mobile Internet offerings, which were well-received by customers. These services contributed to a 37.9% YoY increase in residential customers, to 928k.
The consumer prepaid business recorded service revenue growth of 0.6% in H1, as customers continued to streamline how they consume different-validity voice, data and integrated bundles. While this outcome reflected a slight slowdown in momentum in Q2 (up 0.1% YoY), price increases implemented towards the end of Q2 for prepaid data are anticipated to support an improvement in growth in H2.
The enterprise business remained robust and supported overall, with service revenue up by 15.0% for H1 2024 and 20.0% in Q2 2024, which included once-off benefits within ICT. Normalising for once-offs, Q2 underlying growth was strong at 13.6%, compared to Q1 growth of 10.1% .
Wholesale revenue (including incoming voice revenue) declined marginally by 0.1%, on a strong H1 2023 base, affected by lower interconnect.

The fintech ecosystem continued to grow strongly with total service revenue up by 59.1% in H1, underpinned by effective airtime advance initiatives. Notwithstanding a decline in MAU as a result of a base clean-up, MoMo revenue scaled rapidly from a low base and more than doubled in the period. This was driven by the ongoing expansion of the product portfolio, including insurance and lending services (personal and micro loans). Fintech revenue contributed 4.1% to total service revenue (H1 2023: 2.6%).
The digital business delivered growth of 10.2% in H1, driven by a 26.1% growth in new content subscriptions and 32.3% growth in mobile advertising. MTN SA has signed exclusivity deals with Showmax EPL and Disney+ driving real benefits to customers, which has assisted in customer acquisition and retention.
MTN SA’s EBITDA increased by 3.8%, including the once-off gain from the disposal of SA towers; excluding this effect, EBITDA increased by 4.3% YoY. The EBITDA margin of 36.6% was 0.3pp higher YoY (up 0.4pp to 36.5%, excluding the gain on disposal of SA towers).
The result also benefited from exceptional proceeds of R212 million (2023: nil) – reported within ‘other income’ of R384 million (2023: R103 million) – from the sale of an insurance receivables. Excluding both the effects of gain from disposal of towers and the impact of sale proceeds from the sale of the insurance receivable, H1 2024 EBITDA would have increased by 2.0% and margin would have been 0.4pp lower at 35.7%.
PAT grew by 10.9% to R1.2 billion in H1, while adjusted FCF held broadly flat at R3.1 billion, with the improvement in earnings offset by higher capex.
MTN SA deployed capex of R4.6 billion (ex-leases) in H1, including the completion of the comprehensive network resilience plan in Q1.
MTN Nigeria
MTN Nigeria’s H1 results – published on 30 July 2024 – demonstrated the solid underlying performance of its commercial operations in the face of rising inflation and the continued depreciation of the naira against the US dollar. Despite the barring of subscribers, in line with NCC directives, the subscriber base increased by 2.9% to 79.4 million. Voice and data traffic increased by 6.4% and 42.6%, respectively.
Service revenue grew by 32.4%*, in line with the average local inflation rate in H1. This result was driven by the strong performance in data and supported by solid voice, fintech and digital services.
Voice revenue grew by 12.1%*, underpinned by revamped voice propositions, CVM initiatives and enhanced service quality. Data revenue rose by 54.7%* on increased data usage and an 11.1% increase in active data subscribers to 45.6 million. Growth was also supported by smartphone penetration, which increased to 55.9% (up by 2.9pp YoY).
Fintech revenue grew by 10.4%*, with encouraging growth in the adoption of MoMo services. The number of active wallet users increased by approximately 135 000 to 5.5 million – with a pleasing acceleration in Q2 following the pressure in Q1 from the NIN requirement for KYC validation. Over 174k new merchants were onboarded in the period, to a total of approximately 498k. Digital revenue grew by 98.1%*, supported by the adoption of digital products, expanding partnerships with content providers and the growth of the active base, which was up by 5.6 million to 19.6 million.
Revenue from the enterprise business rose by 64.3%*, led by the expansion of offerings in mobile and fixed connectivity services and underpinned by our expanding SG network.
MTN Nigeria EBITDA decreased by 10.8%*, with the EBITDA margin down by 17.4pp to 35.7%*. This was impacted by naira devaluation, a new VAT introduced on tower leases (since September 2023), higher CPI adjustments on lease rental costs and higher energy costs. Adjusting for the combined effects of forex (15.4pp), the VAT on the tower leases (2.7pp) and the impact of higher energy costs (0.8pp), the EBITDA margin would have been 54.6%*.
MTN Nigeria continues to progress the initiatives previously outlined to accelerate its earnings recovery profile, strengthen the balance sheet and restore positive equity position.

Southern and East Africa (SEA)
The SEA region delivered service revenue growth of 19.6%* YoY, supported by sustained growth in data (+30.8%*), fintech (+24.2%*) and voice revenue (+12.4%*) as well as an increase in subscriber numbers by 8.6% YoY to 41.0 million. SEA’s overall topline growth trended well above the blended inflation of the region, which averaged 8.0% in H1 2024 (June 2023: 12.2%). Fintech revenue contributed 29.0%* to total service revenue (H1 2023: 27.9%*).
Overall, the SEA portfolio reported a 1.1pp* decline in the blended EBITDA margin to 44.0%* in H1. This was mainly due to increased network and commissions and distribution costs, particularly in Rwanda and Zambia.
MTN Uganda, which made up 62% of SEA service revenue, published its H1 results on 5 August 2024. The Opco reported service revenue growth of 20.4%* YoY, supported by a 14.6% YoY growth in the subscriber base to 20.7 million. The strong performance in H1 was driven by solid voice growth (up 15.1%*) and continued momentum in the data (+28.6%*) and fintech (23.4%) segments.
Voice revenue benefited from a sustained aggressive customer acquisition strategy coupled with improved all-network bundle packages. Data revenue was supported by a 26.8% increase in active data users to 8.8 million and 5.9pp growth in smartphone penetration to 41.6% (H1 2023: 35.7%). This was boosted by device financing and strategic partnerships with device manufacturers.
Fintech revenue was driven by increased activity with transaction volume up by 25.2% to 2.0 billion and transaction value up by 12.6%. Advanced revenue contribution continued its growth trajectory and increased to 28.2% (H1 2023: 26.3%).
MTN Uganda’s EBITDA margin expanded by 1.0pp* to 51.5%* driven by strong top-line growth and operational efficiency.
West and Central Africa (WECA)
The WECA region delivered service revenue growth of 9.5%*, with overall subscribers down 0.4% to 72.5 million in an environment characterised by regulatory taxes, elevated inflation and increased competition. Further, the cable cuts in Q1 had a negative impact on the performance of our West African operations in particular. The average blended inflation for the region improved to 11.6% over the period from 19.1% in H1 2023. Excluding Ghana, WECA inflation was stable at 4.4% for the period.
Data and fintech revenue growth for the region of 22.9%* and 25.7%* respectively were key drivers of overall performance. Active data subscribers increased by 8.0% to 35.8 million and active MoMo users increased by 5.9% to 34.9 million. Fintech revenue contributed 20.2%* to total service revenue (H1 2023: 17.6%*).
WECA reported a 15.2%* increase in EBITDA and 2.0pp* expansion in blended EBITDA margin to 40.3%*. Excluding MTN Ghana, the WECA markets reported a 0.4pp* improvement in the blended EBITDA margin to 30.3%*.
MTN Ghana, which made up approximately 38% of WECA service revenue, published H1 results on 31 July 2024. MTN Ghana delivered strong service revenue growth of 31.3%*; with data up by 55.3%*, fintech by 38.3%* and digital by 59.6%*. The subscriber base grew by 3.9% YoY to 28.4 million, despite some headwinds from SIM registration regulation in the country.
Data revenue growth was supported by enhanced 4G connectivity and attributable to a 15.9% YoY increase in active data subscribers, with a 7.2% YoY rise in data usage. MTN Ghana’s data traffic increased by 24.2% in the period.
The fintech performance was driven by a 16.2% YoY increase in the active user base and enhanced digital financial solutions offerings. Advanced services revenue grew by 71.1%* YoY, while basic services also remained robust with cash-out services up by 32.2%* and peer-to-peer transactions up by 43.2%*.
Digital revenue grew strongly driven by video, gaming and ring-back tones. The enhancement of customer experience and a continued focus on providing locally and internationally relevant digital offerings contributed to this growth. The number of ayoba users increased by 14.8% YoY to reach 2.9 million.
EBITDA increased by 31.4%* YoY with the EBITDA margin steady at 56.1%*. This was achieved despite the continued impacts of elevated inflation on costs, which was mitigated by the ongoing execution of expense efficiency initiatives.

MTN Cameroon reported pleasing service revenue growth of 12.9%* (ahead of local inflation of 6.2%) and maintained leading market share in a challenging and highly competitive environment. CVM initiatives drove solid growth in data (up 19.2%*) and fintech (up 27.4%*) revenue, despite increased pricing competition in the market. The EBITDA margin for MTN Cameroon increased 0.5pp* to 37.0%*.
MTN Côte d’Ivoire’s service revenue decreased by 7.9%*, impacted by the large-scale undersea fibre cuts in Q1 2024, which negatively affected voice and data subscriber growth. The regulatory climate also remained challenging, exacerbated by aggressive competition and price wars in the market. Data revenue was 0.8% lower, while fintech revenue (down marginally by 0.2%* YoY) was affected by a declined in MAU and delays in the deployment of new features for Xtratime. More encouragingly, the business delivered strong growth in advanced services of 20.4%*.

In light of the challenging regulatory and competitive environments in the country, MTN Côte d'Ivoire remains in discussions with the appropriate authorities to drive market repair guidelines focused primarily on voice and data. The EBITDA margin increased by 2.1pp* to 33.1%*, a result of the focused execution on the expense efficiency programme.
Middle East and North Africa (MENA)
The MENA results in constant currency include two months of Afghanistan in both the current and comparative periods
In MENA region, we have concluded the exit of the consolidated Middle East subsidiaries following the conclusion in February 2024 of the sale of MTN Afghanistan, which is included for two months in the result. Service revenue for the region declined by 58.9%* YoY, with an EBITDA margin of -11.3%* (down by 49.1pp). This outcome was largely due to the ongoing conflict in Sudan, which broke out in April 2023.
The overall performance of MTN Sudan was affected by prolonged network outages, with a shutdown of the network in February 2024 for approximately three months. Although the network was partially restored at the end of May 2024, the business sustained significant loss of revenue, which exceeded cost rationalisation efforts. Against this backdrop, service revenue declined by 81.7% * with an EBITDA loss.
Associates, joint ventures and investments
Telecoms operations
MTN Irancell, our 49%-held equity-accounted investment, delivered service revenue growth of 49.0%, supported by increased data revenue driven by a tariff increase in January 2024 and increased usage. The EBITDA margin decreased by 0.4pp* to 41.4%*, as the price increases mitigated the impacts of currency devaluation.
E-commerce investments
The Iran Internet Group continued its strong performance in the six-months to June 2024. Ride-hailing app Snapp remained the market leader, ranking among the top ride-hailing apps globally and reaching 4.6 million daily rides (H1 2023: 4.1 million). Last-mile delivery service Snappbox also remained the market leader with revenue up 90% YoY and daily orders increasing by 39% YoY to almost 460k.
Food delivery app Snappfood grew revenue by 102% YoY and remained the largest player in the country.

We are encouraged by the progress in our commercial priorities and initiatives, which position the business to weather the prevailing macro headwinds and deliver on our medium-term growth ambitions. We anticipate that our operating environment will remain challenging in the short term, with inflation headwinds in some markets and local currencies remaining under pressure.
Against this backdrop, we will remain focused on executing on our strategy, guided by disciplined allocation of capital to safeguard the strength and flexibility of our balance sheet.

Accelerating growth in our markets
Looking ahead for MTN SA, the local macroeconomic environment appears to be showing signs of stabilising, particularly in terms of inflation trends. The South African consumer, however, remains constrained with continued pressure on spending. This is driving an ongoing shift in how customers consume postpaid and prepaid bundles, with continuous optimisation and streamlining of spend.
While the pressures on its consumer and wholesale businesses are expected to remain in H2, MTN SA will maintain its focus on sustaining the performance in voice and driving data growth, supported by pricing initiatives in consumer and continued steady performance in enterprise. The impact of the recent price revisions is anticipated to benefit revenue growth in the second half of 2024. MTN SA accelerated its device spend in H1 to gain device market share, which benefited consumer postpaid performance.
MTN SA will continue the work to deliver customer value across all segments as well as enhance its revenue streams to deliver a healthy EBITDA, PAT and cash flow profile.
MTN Nigeria continues to implement the interventions outlined at its EGM, held on 30 April 2024, and has made pleasing headway in driving commercial momentum (achieving accelerated data and fintech growth) and reducing exposure to US dollar denominated obligations. These efforts will go some way in reducing the impacts on the business from the risks in the operating environment.
Importantly, we are pleased with the successful renegotiation of tower contracts in Nigeria, which will enable the business to better manage the foreign exchange exposure in its lease costs, in support of MTN Nigeria’s margin recovery and resolution of its negative equity position.
We will continue to engage with authorities in Nigeria, through the industry body, regarding tariff increases, which remain critical to the recovery and sustainability of the industry in that country.
MTN Ghana and MTN Uganda continue to spearhead growth within our broader Markets portfolio – we have maintained the guidance for these Opcos, underpinned by operational excellence and execution. We will continue to implement our commercial strategies and engage with regulators where necessary to support the growth acceleration ambitions for our markets.
The turnaround of MTN Côte d’Ivoire is a key priority. We are in ongoing engagements with regulators regarding interventions into the regulatory and competitive structure of the market with a view of repairing the performance, particularly voice and data.
In the platform businesses, we will leverage the partnership with Mastercard to continue to scale the fintech ecosystem with a focus on accelerating commercial monetisation, particularly in advanced services. This includes MoMo PSB in Nigeria, where we will build on the encouraging Q2 momentum. The priority for ayoba is to progress the initiatives to ramp up commercial monetisation of the business.
Sustaining our financial resilience
We are satisfied with the progress thus far in our expense efficiency programme and maintain our objective to realise R7-8 billion in cost savings over three years from 2024. We are accelerating initiatives where possible to mitigate the effects of the challenging macro environment on the business.
We are maintaining our target to keep Holdco leverage ratio below 1.5x over the medium term, which underpins the resilience and flexibility of our balance sheet. As previously, guided, we anticipate that the ratio may track slightly above our objective in the current financial year, before returning to the range thereafter. We are pleased with the acceleration we have seen in cash upstreaming from our Opcos, particularly Q2, and this will remain a key focus area in H2.
As noted, MTN Nigeria continues to progress the programmes outlined to recover its profitability and balance sheet profile. In particular we remain committed to the work to resolve the negative equity position, which is a key objective.
Medium-term guidance maintained
Despite the current pressures facing our business, we maintain our overall medium-term guidance framework. We anticipate deploying capex of between R28-33 billion for FY 2024.
While the prevailing macro context presents uncertainty to our near-term outlook, we are encouraged by the resilience in our business and its underlying operational momentum. We believe that we remain positioned to deliver on our medium-term objective to accelerate growth and reveal value for our stakeholders.
Our Level 1 B-BBEE statuses for both MTN SA and the Group, underscore our dedication to creating shared value in the markets we serve. We remain committed to continuing the important work of improving the lives of our communities.
The MTN Zakhele Futhi BEE scheme (MTNZF) is scheduled to mature on 22 November 2024. As such, MTN Group and MTNZF propose to extend the period of the scheme for a further three years, to November 2027. The proposed extension is in line with MTN’s commitment to transformation and creation of shared value for South Africans.
B-BBEE is integral to the ethos of MTN and MTN believes that B-BBEE participation is important to the future success of the Group. The proposed terms and structure of the extension are set out in a joint announcement, that has been published on SENS for shareholders of MTN and MTNZF.
MTN will host a presentation on Monday, 19 August 2024 where we will unpack the Group’s results for the six months to 30 June 2024. To participate, please register here:
https://themediaframe.com/mediaframe/webcast.html?webcastid=zqGB3sfQ
19 August 2024
Fairland
Lead sponsor
Tamela Holdings Proprietary Limited
Joint sponsor
J.P. Morgan Equities (SA) Proprietary Limited
We are targeting capex (ex-leases) of R28-33 billion, based on current currency assumptions, for FY 2024 and capex intensity over the medium term in the 15-18% range.
Headline earnings reconciliation
|
Rm |
IFRS reported 2024 |
Impairment of goodwill, PPE, intangibles and joint venture impairments1 |
Impairment loss on remeasurement of disposal group2 |
Gain on disposal/ dilution of investment in JV/associate/ subsidiary and fair value gain on acquisition of subsidiary3 |
Net gain (after tax) on disposal of SA towers4 |
Other5 |
Headline earnings |
Hyper- inflation6 |
Impact of net foreign exchange losses and gains7 |
Deferred Tax Asset remea- surement8 |
Other non- operational items9 |
Adjusted 2024 |
% movement |
|
|
2024 |
||||||||||||||
|
Revenue |
90 842 |
– |
– |
– |
– |
90 842 |
871 |
– |
– |
– |
91 713 |
(18.7%) |
||
|
Other income |
1 307 |
– |
(1 018) |
(11) |
– |
278 |
1 |
– |
– |
– |
279 |
343.1% |
||
|
EBITDA |
29 929 |
3 807 |
146 |
(1 018) |
(11) |
(35) |
32 818 |
606 |
– |
– |
454 |
33 878 |
(31.8%) |
|
|
Depreciation, amortisation and impairment of goodwill |
(18 189) |
437 |
– |
– |
– |
(17 752) |
1 707 |
– |
– |
– |
(16 045) |
(16.4%) |
||
|
Profit from operations |
11 740 |
4 244 |
146 |
(1 018) |
(11) |
(35) |
15 066 |
2 313 |
– |
– |
454 |
17 833 |
(41.5%) |
|
|
Net finance cost |
(22 956) |
– |
– |
– |
– |
(22 956) |
88 |
16 238 |
– |
– |
(6 630) |
(9.5%) |
||
|
Hyperinflationary monetary gain |
276 |
– |
– |
– |
– |
276 |
(276) |
– |
– |
– |
– |
0.0% |
||
|
Share of results of associates and joint ventures after tax |
1 892 |
– |
– |
– |
(4) |
1 888 |
(390) |
55 |
– |
– |
1 553 |
18.1% |
||
|
Profit before tax |
(9 048) |
4 244 |
146 |
(1 018) |
(11) |
(39) |
(5 726) |
1 735 |
16 293 |
– |
454 |
12 756 |
(47.8%) |
|
|
Income tax expense |
(629) |
– |
– |
– |
3 |
– |
(626) |
(377) |
(4 700) |
500 |
– |
(5 203) |
(35.4%) |
|
|
Profit after tax |
(9 677) |
4 244 |
146 |
(1 018) |
(8) |
(39) |
(6 352) |
1 358 |
11 593 |
500 |
454 |
7 553 |
(53.9%) |
|
|
Non-controlling interests |
2 287 |
(580) |
– |
– |
2 |
1 709 |
(325) |
(2 214) |
– |
– |
(830) |
(70.4%) |
||
|
Attributable profit |
(7 390) |
3 664 |
146 |
(1 018) |
(8) |
(37) |
(4 643) |
1 033 |
9 379 |
500 |
454 |
6 723 |
(50.5%) |
|
|
EBITDA margin |
32.9% |
36.1% |
36.9% |
|||||||||||
|
Effective tax rate |
(7.0%) |
(10.9%) |
40.8% |
|||||||||||
|
Rm |
IFRS reported 2023 (Restated*) |
Impairment of goodwill, PPE, intangibles and joint venture impairments1 |
Impairment loss on remeasurement of disposal group2 |
Gain on disposal/ |
Net gain (after tax) on disposal of SA towers4 |
Other5 |
Headline earnings |
Hyper- inflation6 |
Impact of net foreign exchange losses and gains7 |
Deferred Tax Asset remea- surement8 |
Other non- operational items9 |
Adjusted 2023 (Restated*) |
|
|
2023 |
|||||||||||||
|
Revenue |
113 203 |
– |
– |
– |
– |
113 203 |
(451) |
– |
– |
– |
112 752 |
||
|
Other income |
116 |
– |
– |
– |
(53) |
– |
63 |
– |
– |
– |
– |
63 |
|
|
EBITDA |
48 868 |
253 |
385 |
– |
(53) |
(22) |
49 431 |
226 |
– |
– |
– |
49 657 |
|
|
Depreciation, amortisation and impairment of goodwill |
(19 597) |
– |
– |
– |
– |
(19 597) |
401 |
– |
– |
– |
(19 196) |
||
|
Profit from operations |
29 271 |
253 |
385 |
– |
(53) |
(22) |
29 834 |
627 |
– |
– |
– |
30 461 |
|
|
Net finance cost |
(22 172) |
– |
– |
– |
– |
(22 172) |
30 |
14 817 |
– |
– |
(7 325) |
||
|
Hyperinflationary monetary gain |
155 |
– |
– |
– |
– |
155 |
(155) |
– |
– |
– |
– |
||
|
Share of results of associates and joint ventures after tax |
1 008 |
– |
– |
– |
4 |
1 012 |
220 |
83 |
– |
– |
1 315 |
||
|
Profit before tax |
8 262 |
253 |
385 |
– |
(53) |
(18) |
8 829 |
722 |
14 900 |
– |
– |
24 451 |
|
|
Income tax expense |
(3 827) |
– |
– |
– |
14 |
– |
(3 813) |
38 |
(4 282) |
– |
– |
(8 057) |
|
|
Profit after tax |
4 435 |
253 |
385 |
– |
(39) |
(18) |
5 016 |
760 |
10 618 |
– |
– |
16 394 |
|
|
Non-controlling interests |
(294) |
(30) |
(1) |
(325) |
(72) |
(2 412) |
– |
– |
(2 809) |
||||
|
Attributable profit |
4 141 |
223 |
385 |
– |
(39) |
(19) |
4 691 |
688 |
8 206 |
– |
– |
13 585 |
|
|
EBITDA margin |
43.2% |
43.7% |
44.0% |
||||||||||
|
Effective tax rate |
46.3% |
43.2% |
33.0% |
||||||||||
| 1 | Represents the exclusion of the impact of goodwill, PPE, intangibles and joint venture impairments. H1 24: goodwill (Ayo Group: R437 million), PPE (R2 822 million) and intangibles (R405 million); H1 23: PPE (R220 million) and intangibles (R3 million). |
| 2 | Represents the impairment loss on remeasurement of disposal group. H1 24: Afghanistan (R146 million); H1 23: Afghanistan (R385 million). |
| 3 | Represents the gain on disposal/dilution of investment in JV/associate/subsidiary and fair value gain on acquisition of subsidiary (gain on disposal of Afghanistan – H1 24: R1 018 million; H1 23: R0 million). |
| 4 | Represents net gain (after tax) on disposal of SA towers. (H1 24: R8 million; H1 23: R39 million). |
| 5 | Represents the net profit on disposal of PPE and intangibles. H1 24: PPE (R33 million profit) and share of results from Iran (R4 million profit); H1 23: PPE (R15 million profit) and share of results from Iran (R4 million profit). |
| 6 | The impact of hyperinflation is excluded for the operations that are currently accounted for on a hyperinflationary basis (MTN Irancell, MTN Sudan, MTN South Sudan and MTN Ghana), as well as those that have previously been accounted for on a hyperinflationary basis. The economy of Iran was assessed to be hyperinflationary effective 1 January 2020 and hyperinflation accounting has since been applied. The economy of Sudan was assessed to be hyperinflationary during 2018 and hyperinflation accounting has since been applied. The economy of South Sudan was assessed to be hyperinflationary effective 1 January 2016 and hyperinflation accounting has since been applied. The economy of Ghana was assessed to be hyperinflationary effective 1 January 2023 and hyperinflation accounting has since been applied. |
| 7 | Adjustment for the net forex (gains)/losses impacting earnings for the respective periods. (H1 24: forex loss of R9 378 million; H1 23: forex loss of R8 206 million). This includes the impact of forex in Iran. |
| 8 | Represents deferred tax assets remeasurement on Mauritius’ prior year recognised tax expense (H1 24: R500 million; H1 23: R0 million). |
| 9 | Represents other non-operational items relating to H1 24: fintech separation costs and ATA matters of R454 million and H1 23: fintech separation costs and ATA matters of R0 million. |
Group total revenue increased by 11.6%* and service revenue increased by 12.1%*, with service revenue growth of 3.3% in MTN SA, 32.4%* in MTN Nigeria, 31.3%* in MTN Ghana and 20.4%* in MTN Uganda. MTN Sudan was a drag on topline growth, owing to the ongoing conflict in that country.
Table 1: Group revenue by country
|
Actual (Rm) |
Prior (Rm) |
Reported % change |
Constant currency % change |
Contribution to revenue % |
|
|
South Africa |
26 198 |
25 417 |
3.1 |
3.1 |
28.8 |
|
Nigeria |
20 667 |
43 813 |
(52.8) |
32.7 |
22.8 |
|
SEA |
11 986 |
11 088 |
8.1 |
19.7 |
13.2 |
|
Uganda |
7 456 |
6 200 |
20.3 |
20.2 |
8.2 |
|
Rwanda |
1 802 |
1 991 |
(9.5) |
2.3 |
2.0 |
|
Other SEA |
2 728 |
2 897 |
(5.8) |
33.2 |
3.0 |
|
WECA |
29 524 |
27 223 |
8.5 |
9.6 |
32.5 |
|
Ghana |
11 347 |
9 427 |
20.4 |
31.3 |
12.5 |
|
Cameroon |
5 457 |
4 689 |
16.4 |
13.2 |
6.0 |
|
Côte d'Ivoire |
4 899 |
5 165 |
(5.2) |
(7.8) |
5.4 |
|
Other WECA |
7 821 |
7 942 |
(1.5) |
(4.3) |
8.6 |
|
MENA |
736 |
3 493 |
(78.9) |
(58.7) |
0.8 |
|
Sudan |
238 |
2 245 |
(89.4) |
(81.6) |
0.3 |
|
Afghanistan# |
498 |
1 248 |
(60.1) |
1.0 |
0.5 |
|
Bayobab |
5 678 |
5 946 |
(4.5) |
(6.6) |
6.3 |
|
Head offices and eliminations |
(3 076) |
(4 228) |
(3.4) |
||
|
Total |
91 713 |
112 752 |
(18.7) |
11.6 |
101.0 |
|
Hyperinflation |
(871) |
451 |
(1.0) |
||
|
Total reported |
90 842 |
113 203 |
(19.8) |
11.6 |
100.0 |
|
# Constant currency includes two months of prior year financial results while reported includes 12 months results. |
|||||
Table 2: Group service revenue by country
|
Actual (Rm) |
Prior (Rm) |
Reported % change |
Constant currency % change |
Contribution to service revenue % |
|
|
South Africa |
21 110 |
20 431 |
3.3 |
3.3 |
24.7 |
|
Nigeria |
20 523 |
43 583 |
(52.9) |
32.4 |
24.1 |
|
SEA |
11 822 |
10 944 |
8.0 |
19.6 |
13.9 |
|
Uganda |
7 371 |
6 116 |
20.5 |
20.4 |
8.6 |
|
Rwanda |
1 757 |
1 969 |
(10.8) |
0.9 |
2.1 |
|
Other SEA |
2 694 |
2 859 |
(5.8) |
33.4 |
3.2 |
|
WECA |
29 403 |
27 131 |
8.4 |
9.5 |
34.5 |
|
Ghana |
11 302 |
9 394 |
20.3 |
31.3 |
13.2 |
|
Cameroon |
5 424 |
4 675 |
16.0 |
12.9 |
6.4 |
|
Côte d'Ivoire |
4 878 |
5 147 |
(5.2) |
(7.9) |
5.7 |
|
Other WECA |
7 799 |
7 915 |
(1.5) |
(4.2) |
9.1 |
|
MENA |
730 |
3 480 |
(79.0) |
(58.9) |
0.9 |
|
Sudan |
235 |
2 237 |
(89.5) |
(81.7) |
0.3 |
|
Afghanistan# |
495 |
1 243 |
(60.2) |
1.0 |
0.6 |
|
Bayobab |
5 678 |
5 946 |
(4.5) |
(6.6) |
6.7 |
|
Head offices and eliminations |
(3 076) |
(4 228) |
(3.6) |
||
|
Total |
86 190 |
107 287 |
(19.7) |
12.1 |
101.0 |
|
Hyperinflation |
(867) |
448 |
(1.0) |
||
|
Total reported |
85 323 |
107 735 |
(20.8) |
12.1 |
100.0 |
|
# Constant currency includes two months of prior year financial results while reported includes 12 months results. |
|||||
Table 3: Group revenue by segment
|
Actual (Rm) |
Prior (Rm) |
Reported % change |
Constant currency % change |
Contribution to revenue % |
|
|
Outgoing voice 1 |
25 150 |
37 870 |
(33.6) |
(0.2) |
27.7 |
|
Incoming voice 2 |
4 423 |
6 436 |
(31.3) |
(1.3) |
4.9 |
|
Data 3 |
35 346 |
41 877 |
(15.6) |
21.0 |
38.9 |
|
Digital 4 |
1 599 |
1 759 |
(9.1) |
19.3 |
1.8 |
|
Fintech 5 |
10 961 |
9 992 |
9.7 |
27.2 |
12.1 |
|
SMS |
1 743 |
2 750 |
(36.6) |
5.6 |
1.9 |
|
Devices |
5 523 |
5 465 |
1.1 |
4.3 |
6.1 |
|
Wholesale 6 |
4 355 |
4 148 |
5.0 |
6.9 |
4.8 |
|
Other |
2 613 |
2 455 |
6.4 |
13.9 |
2.9 |
|
Total |
91 713 |
112 752 |
(18.7) |
11.6 |
101.0 |
|
Hyperinflation |
(871) |
451 |
(1.0) |
||
|
Total reported |
90 842 |
113 203 |
(19.8) |
11.6 |
100.0 |
|
1 Excludes international roaming and wholesale. 2 Includes local and international roaming and excludes wholesale. 3 Includes mobile and fixed access data and excludes roaming and wholesale. 4 Includes Rich Media services, content VAS, eCommerce and mobile advertising. 5 Includes Xtratime and mobile financial services. 6 Includes domestic wholesale, voice, SMS and data, leased lines and BTS rentals. |
|||||
Table 4: Group data revenue1
|
Actual Rm |
Prior Rm |
Reported % change |
Constant currency % change |
|
|
South Africa |
10 044 |
9 811 |
2.4 |
2.4 |
|
Nigeria |
9 760 |
17 753 |
(45.0) |
54.7 |
|
SEA |
3 054 |
2 625 |
16.3 |
30.8 |
|
Uganda |
1 828 |
1 420 |
28.7 |
28.6 |
|
Rwanda |
306 |
351 |
(12.8) |
(1.6) |
|
Other SEA |
920 |
854 |
7.7 |
52.8 |
|
WECA |
12 046 |
9 982 |
20.7 |
22.9 |
|
Ghana |
5 527 |
3 911 |
41.3 |
55.3 |
|
Cameroon |
2 177 |
1 777 |
22.5 |
19.2 |
|
Côte d'Ivoire |
1 698 |
1 664 |
2.0 |
(0.8) |
|
Other WECA |
2 644 |
2 630 |
0.5 |
(2.3) |
|
MENA |
307 |
1 575 |
(80.5) |
(62.7) |
|
Sudan |
84 |
1 061 |
(92.1) |
(86.5) |
|
Afghanistan# |
223 |
514 |
(56.6) |
10.4 |
|
Bayobab |
4 |
3 |
33.3 |
33.3 |
|
Head offices and eliminations |
131 |
128 |
||
|
Total |
35 346 |
41 877 |
(15.6) |
21.0 |
|
Hyperinflation |
(465) |
272 |
||
|
Total reported |
34 881 |
42 149 |
(17.2) |
21.0 |
|
1 Includes mobile and fixed access data and excludes roaming and wholesale. # Constant currency includes two months of prior year financial results while reported includes 12 months results. |
||||
Table 5: Group fintech revenue2
|
Actual (Rm) |
Prior (Rm) |
Reported % change |
Constant currency % change |
|
|
South Africa |
859 |
540 |
59.1 |
59.1 |
|
Nigeria |
649 |
1 651 |
(60.7) |
10.4 |
|
SEA |
3 428 |
2 956 |
16.0 |
24.2 |
|
Uganda |
2 166 |
1 754 |
23.5 |
23.4 |
|
Rwanda |
810 |
727 |
11.4 |
26.0 |
|
Other SEA |
452 |
475 |
(4.8) |
24.5 |
|
WECA |
5 929 |
4 828 |
22.8 |
25.7 |
|
Ghana |
2 835 |
2 230 |
27.1 |
38.3 |
|
Cameroon |
1 055 |
808 |
30.6 |
27.4 |
|
Côte d’Ivoire |
470 |
458 |
2.6 |
(0.2) |
|
Other WECA |
1 569 |
1 332 |
17.8 |
14.6 |
|
MENA |
9 |
22 |
(59.1) |
0.0 |
|
Sudan |
1 |
5 |
(80.0) |
(66.7) |
|
Afghanistan# |
8 |
17 |
(52.9) |
33.3 |
|
Bayobab |
1 |
– |
100.0 |
100.0 |
|
Head offices and eliminations |
87 |
(5) |
||
|
Total |
10 961 |
9 992 |
9.7 |
27.2 |
|
Hyperinflation |
(242) |
– |
||
|
Total reported |
10 719 |
9 992 |
7.3 |
27.2 |
|
2 Includes Xtratime and mobile financial services. # Constant currency includes two months of prior year financial results while reported includes 12 months results. |
||||
Table 6: Group digital revenue3
|
Actual (Rm) |
Prior (Rm) |
Reported % change |
Constant currency % change |
|
|
South Africa |
669 |
607 |
10.2 |
10.2 |
|
Nigeria |
408 |
579 |
(29.5) |
98.1 |
|
SEA |
56 |
65 |
(13.8) |
0.0 |
|
Uganda |
29 |
23 |
26.1 |
26.1 |
|
Rwanda |
12 |
14 |
(14.3) |
0.0 |
|
Other SEA |
15 |
28 |
(46.4) |
(28.6) |
|
WECA |
452 |
421 |
7.4 |
7.1 |
|
Ghana |
142 |
97 |
46.4 |
59.6 |
|
Cameroon |
124 |
123 |
0.8 |
(1.6) |
|
Côte d’Ivoire |
158 |
160 |
(1.3) |
(4.2) |
|
Other WECA |
28 |
41 |
(31.7) |
(33.3) |
|
MENA |
11 |
88 |
(87.5) |
(76.6) |
|
Sudan |
4 |
66 |
(93.9) |
(89.5) |
|
Afghanistan# |
7 |
22 |
(68.2) |
(22.2) |
|
Bayobab |
– |
– |
0.0 |
0.0 |
|
Head offices and eliminations |
3 |
(1) |
||
|
Total |
1 599 |
1 759 |
(9.1) |
19.3 |
|
Hyperinflation |
(14) |
13 |
||
|
Total reported |
1 585 |
1 772 |
(10.6) |
19.3 |
|
3 Includes rich media services, content VAS, eCommerce and mobile advertising. # Constant currency includes two months of prior year financial results while reported includes 12 months results. |
||||
Table 7: Cost analysis
|
Actual (Rm) |
Prior (Rm) |
Reported % change |
Constant currency % change |
% of revenue |
|
|
Handsets and other accessories |
6 016 |
6 140 |
(2.0) |
3.8 |
6.6 |
|
Interconnect |
4 330 |
5 316 |
(18.5) |
20.1 |
4.8 |
|
Roaming |
983 |
672 |
46.3 |
68.3 |
1.1 |
|
Commissions |
6 982 |
7 046 |
(0.9) |
6.1 |
7.7 |
|
Government and regulatory costs |
3 754 |
4 182 |
(10.2) |
13.0 |
4.1 |
|
VAS / Digital revenue share |
1 577 |
2 030 |
(22.3) |
(2.9) |
1.7 |
|
Service provider discounts |
1 612 |
2 573 |
(37.3) |
16.4 |
1.8 |
|
Network and IS maintenance |
18 208 |
19 077 |
(4.6) |
50.1 |
20.0 |
|
Marketing |
1 741 |
2 223 |
(21.7) |
0.3 |
1.9 |
|
Staff costs |
6 867 |
7 104 |
(3.3) |
11.1 |
7.6 |
|
Other opex |
6 468 |
6 853 |
(5.6) |
13.3 |
7.1 |
|
Total |
58 538 |
63 216 |
(7.4) |
20.3 |
64.4 |
|
Impairment loss on remeasurement of disposal group |
146 |
385 |
0.2 |
||
|
Impairment loss on Sudan warehouse due to ongoing conflict |
– |
173 |
0.0 |
||
|
Hyperinflation |
3 537 |
678 |
3.9 |
||
|
Total reported |
62 219 |
64 452 |
(3.5) |
20.3% |
68.5% |
Table 8: Group EBITDA by country
|
Actual (Rm) |
Prior (Rm) |
Reported % change |
Constant currency % change |
|
|
South Africa |
9 566 |
9 173 |
4.3 |
4.3 |
|
Nigeria |
7 377 |
23 260 |
(68.3) |
(10.8) |
|
SEA |
5 268 |
4 889 |
7.8 |
16.6 |
|
Uganda |
3 842 |
3 134 |
22.6 |
22.6 |
|
Rwanda |
565 |
897 |
(37.0) |
(28.8) |
|
Other |
861 |
858 |
0.3 |
46.4 |
|
WECA |
11 886 |
10 621 |
11.9 |
15.2 |
|
Ghana |
6 371 |
5 293 |
20.4 |
31.4 |
|
Cameroon |
2 021 |
1 716 |
17.8 |
15.0 |
|
Côte d’Ivoire |
1 621 |
1 604 |
1.1 |
(1.5) |
|
Other |
1 873 |
2 008 |
(6.7) |
(9.6) |
|
MENA |
(83) |
1 239 |
(106.7) |
(112.3) |
|
Sudan |
(241) |
871 |
(127.7) |
(144.5) |
|
Afghanistan# |
158 |
368 |
(57.1) |
17.0 |
|
Bayobab |
591 |
1 195 |
(50.5) |
(51.0) |
|
Head offices and eliminations |
(1 151) |
(778) |
||
|
CODM EBITDA |
33 454 |
49 599 |
(32.6) |
(0.4) |
|
Gain on disposal of SA towers |
11 |
53 |
||
|
Impairment loss on remeasurement of disposal group |
(146) |
(385) |
||
|
Impairment loss on Sudan assets due to war |
– |
(173) |
||
|
Profit on sale on Afghanistan |
1 018 |
– |
||
|
Hyperinflation |
(4 408) |
(226) |
||
|
CODM EBITDA before impairment of goodwill and joint ventures |
29 929 |
48 868 |
(38.8) |
(0.4) |
# Constant currency includes two months of prior year financial results while reported includes 12 months results.
Table 9: Group depreciation and amortisation
|
Depreciation restated |
Amortisation |
|||||||
|
Actual (Rm) |
Prior (Rm) |
Reported % change |
Constant currency % change |
Actual (Rm) |
Prior (Rm) |
Reported % change |
Constant currency % change |
|
|
South Africa |
4 825 |
4 462 |
8.1 |
8.1 |
831 |
894 |
(7.0) |
(7.0) |
|
Nigeria† |
2 702 |
5 940 |
(54.5) |
28.4 |
567 |
1 389 |
(59.2) |
15.2 |
|
SEA |
1 637 |
1 458 |
12.3 |
20.8 |
441 |
335 |
31.6 |
45.5 |
|
Uganda |
954 |
875 |
9.0 |
9.2 |
217 |
160 |
35.6 |
35.6 |
|
Rwanda |
476 |
340 |
40.0 |
58.1 |
92 |
77 |
19.5 |
33.3 |
|
Other SEA |
207 |
243 |
(14.8) |
15.0 |
132 |
98 |
34.7 |
78.4 |
|
WECA |
3 560 |
3 382 |
5.3 |
5.5 |
907 |
773 |
17.3 |
18.4 |
|
Ghana |
1 258 |
1 004 |
25.3 |
36.4 |
257 |
201 |
27.9 |
44.4 |
|
Cameroon |
697 |
577 |
20.8 |
17.3 |
166 |
103 |
61.2 |
55.1 |
|
Côte d'Ivoire |
858 |
811 |
5.8 |
2.6 |
262 |
216 |
21.3 |
19.1 |
|
Other WECA |
747 |
990 |
(24.5) |
(26.8) |
222 |
253 |
(12.3) |
(14.9) |
|
MENA |
26 |
51 |
(49.0) |
(3.7) |
19 |
29 |
(34.5) |
35.7 |
|
Sudan |
26 |
51 |
(49.0) |
0.0 |
19 |
29 |
(34.5) |
35.7 |
|
Afghanistan# |
– |
– |
0.0 |
0.0 |
– |
– |
0.0 |
0.0 |
|
Bayobab |
319 |
305 |
4.5 |
3.2 |
55 |
29 |
89.7 |
89.7 |
|
Head offices and eliminations |
(8) |
18 |
163 |
130 |
||||
|
Total |
13 061 |
15 616 |
(16.4) |
12.2 |
2 983 |
3 579 |
(16.7) |
13.5 |
|
Hyperinflation |
1 537 |
347 |
171 |
55 |
||||
|
Total reported |
14 598 |
15 963 |
(8.5) |
12.2 |
3 154 |
3 634 |
(13.2) |
13.5 |
† Nigeria’s depreciation has been restated to be in line with restated right-of-use asset which was incorrectly accounted for as per IFRS 16 in the prior year.
# Constant currency includes two months of prior year financial results while reported includes 12 months results.
The Group depreciation and amortisation costs increased by 12.2%* and 13.5%*, respectively, largely due to network equipment capex and spectrum additions as well as lease modifications.
Table 10: Net finance cost
|
Actual (Rm) |
Prior† (Rm) |
Reported % change |
Constant currency % change |
% of revenue |
|
|
Net interest paid/(received) |
6 630 |
7 324 |
(9.5) |
28.1 |
7.3 |
|
Net forex losses/(gains) |
16 238 |
14 818 |
9.6 |
175.0 |
17.9 |
|
Total |
22 868 |
22 142 |
3.3 |
106.4 |
25.2 |
|
Hyperinflation |
88 |
30 |
0.1 |
||
|
Total reported |
22 956 |
22 172 |
3.5 |
106.4 |
25.3 |
†Nigeria’s net finance costs have been restated to correctly reflect the foreign exchange losses and finance lease costs which were incorrectly accounted for in the prior year.
Net finance costs increased by 106.4%* and 3.5% on a reported basis to R23.0 billion. Higher finance costs were predominantly driven by higher net forex losses (up 175.0%*, and 9.6% on a reported basis to R16.2 billion) due to an increase in net forex losses in Nigeria following significant naira devaluation in that country.
The average cost of borrowing was 12.8% (2023: 10.8%) as a result of global interest rate hikes.
We recorded a positive contribution of R1.9 billion from associates and joint ventures up 87.7% (37.7%*) YoY. The contribution for H1 2024 was largely attributable to improved results from the Iran Internet Group (IIG).
Table 11: Taxation
|
Actual (Rm) |
Prior† (Rm) |
Reported % change |
Constant currency % change |
Contribution to taxation % |
|
|
Normal tax |
3 455 |
4 080 |
(15.3) |
(24.0) |
549.3 |
|
Deferred tax |
(3 149) |
(786) |
(300.6) |
(145.4) |
(500.6) |
|
Foreign income and withholding taxes |
700 |
495 |
41.4 |
60.9 |
111.3 |
|
Total |
1 006 |
3 789 |
(73.4) |
(72.8) |
159.9 |
|
Hyperinflation |
(377) |
38 |
(59.9) |
||
|
Total reported |
629 |
3 827 |
(83.6) |
(72.8) |
100.0 |
† Nigeria’s deferred tax has been restated to reflect the tax impact on the restated depreciation and net finance costs.
The Group tax charges amounted to R629 million in H1, against a PBT loss of R9.0 billion. The Group had significantly higher Sudan non-deductible expenses, hyperinflationary adjustments, as well as unrecognised deferred tax assets.
Cash inflows generated from operations decreased by 39.4% to R27.5 billion, with key cash outflows including tax paid of R5.8 billion, net interest paid of R5.8 billion and cash capex of R13.7 billion (excluding spectrum and licences).
OpFCF decreased by 55.8%, impacted mainly by the decrease in reported EBITDA due to significant Naira devaluation. Excluding the acquisition of spectrum and licences, underlying OpFCF was down 51.8%.
Table 12: Capital expenditure
|
Prior (ex-leases) (Rm) |
Reported % change |
Constant currency % change |
||||
|
South Africa |
5 757 |
4 625 |
4 076 |
13.5 |
13.5 |
||
|
Nigeria |
4 459 |
1 948 |
6 311 |
(69.1) |
(18.3) |
||
|
SEA |
3 229 |
1 891 |
1 724 |
9.7 |
20.0 |
||
|
Uganda |
1 786 |
1 073 |
977 |
9.8 |
8.6 |
||
|
Rwanda |
477 |
425 |
321 |
32.4 |
47.9 |
||
|
Other SEA |
966 |
393 |
426 |
(7.7) |
30.9 |
||
|
WECA |
5 457 |
4 556 |
4 246 |
7.3 |
23.6 |
||
|
Ghana |
2 927 |
2 264 |
1 473 |
53.7 |
61.3 |
||
|
Cameroon |
929 |
533 |
812 |
(34.4) |
(36.7) |
||
|
Côte d'Ivoire |
483 |
640 |
851 |
(24.8) |
(26.8) |
||
|
Other WECA |
1 118 |
1 119 |
1 110 |
0.8 |
0.4 |
||
|
MENA |
13 |
13 |
336 |
(96.1) |
(93.2) |
||
|
Sudan |
– |
– |
315 |
(100.0) |
(100.0) |
||
|
Afghanistan# |
13 |
13 |
21 |
(38.1) |
(48.0) |
||
|
Bayobab |
254 |
254 |
302 |
(15.9) |
(16.7) |
||
|
Head offices and eliminations |
194 |
191 |
186 |
||||
|
Total |
19 363 |
13 478 |
17 181 |
(21.6) |
8.3 |
||
|
Hyperinflation |
(143) |
(45) |
51 |
||||
|
Total reported |
19 220 |
13 433 |
17 232 |
(22.0) |
8.3 |
||
|
# Constant currency includes two months of prior year financial results while reported includes 12 months results. |
|||||||
Table 13: Net debt analysis
|
Rm |
Cash and cash equivalents~ |
Interest- bearing liabilities |
Inter- company eliminations |
Net interest- bearing liabilities |
Net debt/ (cash) June 2024 |
Net debt/ (cash) December 2023 |
|
South Africa |
369 |
28 327 |
(28 327) |
– |
(369) |
(995) |
|
Nigeria |
5 169 |
11 455 |
– |
11 455 |
6 286 |
8 669 |
|
SEA |
1 643 |
4 028 |
(564) |
3 464 |
1 821 |
783 |
|
Uganda |
542 |
1 073 |
– |
1 073 |
531 |
(234) |
|
Rwanda |
271 |
969 |
(13) |
956 |
685 |
700 |
|
Other SEA |
830 |
1 986 |
(551) |
1 435 |
605 |
317 |
|
WECA |
6 877 |
11 392 |
(3 725) |
7 667 |
790 |
(2 472) |
|
Ghana |
2 221 |
168 |
– |
168 |
(2 053) |
(4 549) |
|
Cameroon |
2 730 |
2 278 |
– |
2 278 |
(452) |
(506) |
|
Côte d’Ivoire |
540 |
3 392 |
– |
3 392 |
2 852 |
2 661 |
|
Other WECA |
1 386 |
5 554 |
(3 725) |
1 829 |
443 |
(78) |
|
MENA |
285 |
4 720 |
(4 720) |
– |
(285) |
(936) |
|
Sudan |
285 |
4 608 |
(4 608) |
– |
(285) |
(936) |
|
Afghanistan |
– |
112 |
(112) |
– |
– |
– |
|
Bayobab |
944 |
– |
116 |
116 |
(828) |
(2 047) |
|
Head offices and eliminations |
11 452 |
53 071 |
(1 353) |
51 718 |
40 266 |
31 916 |
|
Total reported |
26 739 |
112 993 |
(38 573) |
74 420 |
47 681 |
34 918 |
|
Iran |
1 063 |
1 333 |
– |
1 333 |
270 |
886 |
~ Includes restricted cash, current investments and excludes cash held for sale in Afghanistan, Conakry and Bissau.
Group net debt increased to R47.7 billion from R34.9 billion, in December 2023, driven mainly by an increase in debt at Holdco level and lower cash balances. In the period, we paid down debt of approximately R16.3 billion, including R8.4 billion by MTN Nigeria.
At the end of June 2024, the Group's net-debt-to-EBITDA ratio of 0.8x (31 December 2023: 0.4x) remained within our loan covenant limit of 2.5x. Our net interest cover stood at 3.6x. Although this is below our covenant threshold in the short term, we have secured accommodations from lenders in this regard and will continue the work to restore this. Our Group cash and cash equivalents balance at the end of June 2024 was R26.7 billion.
Holdco net debt increased to R40.3 billion, from R31.9 billion in December 2023, mostly due to forex impacts on the Eurobonds and new borrowings. Our Holdco debt currency mix ratio (US$:ZAR) improved to 22:78 (31 December 2023: 23:77), well within our medium-term objective of maintaining foreign currency denominated debt to below 40%.
At the end of the period, our Holdco leverage increased to 1.6x, impacted by foreign exchange movements.

