

Downloads

X

All about MTN
Add section
Welcome to our 2025 Integrated Report
Our reporting suite
Our approach to integrated thinking and value creation
Our approach to materiality
About this report
An overview of MTN Group
Where we operate and how we perform
Views from our Chairman
Q&A with the Group President and CEO
Q&A with the Group CFO
Key financial tables
Our market context
Operational performance summary
Our outlook
Investment case – Transforming Africa's growth potential

How we create and preserve value
Add section
Creating and preserving value through our business model
Outcomes and trade-offs
Material matters impacting value creation
Social, Ethics and Sustainability Committee Chair's review
Stakeholders with whom we partner to create value
Audit Committee Chair’s review
Risk Management and Compliance Committee Chair’s review
How we manage risk
Top risks to value creation
Delivering value through our strategy
Add section
Finance and Investment Committee Chair’s review
Our Ambition 2030 strategy
Meaningful value delivered by Ambition 2025
Our strategic performance dashboard
Connectivity
Fintech
Digital infrastructure
Create shared value

Governance and remuneration
Add section
Directors' Affairs and Governance Committee Chair’s review
Governance in support of value creation
Our Board of Directors
Governance in support of value creation
Our Executive Committee
Human Capital and Remuneration Committee Chair's review
Remuneration Report summary
Definitions for assured non-financial data
Independent assurance practitioner’s limited assurance report
Glossary
Administration
All about MTN

Where we operate and how we performed

icon-parttern icon-parttern

MTN Group is a Pan-African digital operator, serving 307.2 million customers across 16 markets. Robust operational and governance oversight structures underpin our growth strategy. In November 2025, we streamlined our operating model for greater efficiency and growth. As a result, our operations are organised as follows: South Africa; Nigeria; Ghana; SEA; and Francophone Africa.
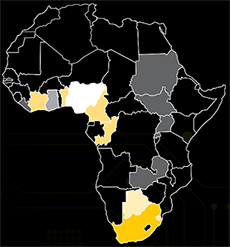

Map
Map

Δ Equity accounted, not under MTN operation.

    MTN Group
effective
shareholding
Subscribers
South Africa flag MTN South Africa 100.0% 40.6m
Nigeria flag MTN Nigeria 76.3% 87.3m
Ghana flag MTN Ghana 72.9% 31.2m
SEA
Uganda flag MTN Uganda 76.0% 24.2m
Rwanda flag MTN Rwanda 80.0% 8.2m
Zambia flag MTN Zambia 89.8% 7.0m
South Sudan flag MTN South Sudan 100.0% 4.2m
Sudan flag MTN Sudan 85.0% 3.2m
Liberia flag LonestarCell (MTN Liberia) 60.0% 2.2m
Francophone Africa
Cameroon flag MTN Cameroon 80.0% 13.1m
Côte d'Ivoire flag MTN Côte d'Ivoire 66.8% 15.3m
Benin flag MTN Benin 75.0% 6.4m
Congo-Brazzaville flag MTN Congo-Brazzaville 100.0% 3.9m
Associates, JVs and other investmentsΔ
Irancell GroupΔ 49.0% 57.6m
Botswana flag Mascom BotswanaΔ 53.1% 1.9m
Eswatini flag MTN EswatiniΔ 30.0% 1.1m
  The Group also has investments in aYo (50%); IHS Group (24.7%); Snapp Group (29.5%); Middle East Tech Ventures Holding (50.0%) and others.
Our financial performance

+22.7%* to R218.5bn
service revenue

+36.4%* to R101.5bn
data revenue

+23.2%* to R30.3bn
fintech revenue

+36.8%* to R98.5bn
EBITDA

17.0%*
capex intensity

R38.5bn
capex (ex-leases)

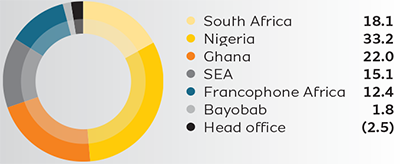
Service revenue contribution

by geography %

Geography graph

by services %

Services graph
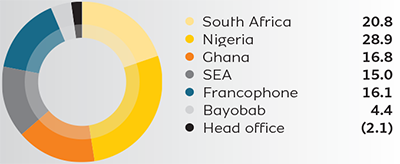
EBITDA contribution

by geography %

Geography graph